Investors are Oblivious to the Market’s Downside Potential
This is a brief update on a number of sentiment/positioning indicators we have frequently discussed in these pages in the past. In this missive our focus is exclusively on indicators that are of medium to long-term relevance to prospective stock market returns. Such indicators are not really useful for the purpose of market timing – instead they are telling us something about the likely duration and severity of the bust that will follow on the heels of the current market mania. The first chart is an update of the current situation in RYDEX funds. Despite their small size, these funds have always represented a quite accurate microcosm of general market sentiment.
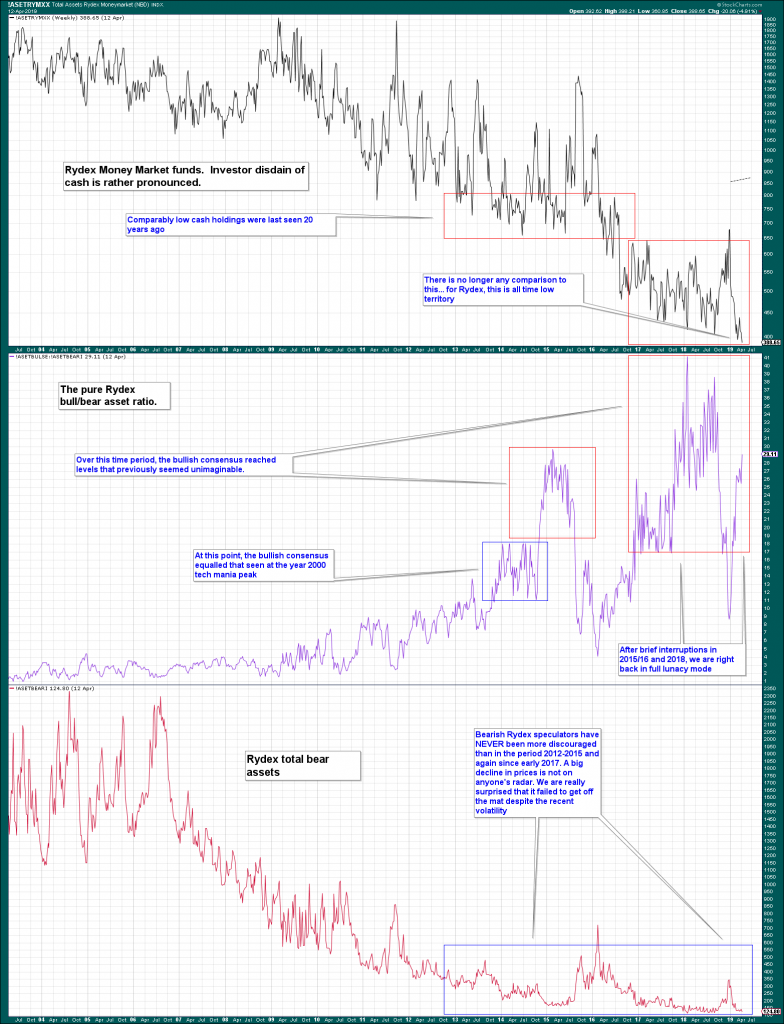
A RYDEX overview: RYDEX money market fund assets have recently declined to new all time lows; the pure non-leveraged bull-bear fund ratio is back above 29 (i.e., bull funds assets are more then 29 times larger than bear fund assets). At the top of the tech mania in early March 2000, this ratio peaked at roughly 17. Lastly, the amount of assets in RYDEX bear funds demonstrates that bears remain extremely discouraged. It is fair to say that at this stage almost no-one expects that the market could suffer a serious slump.
The next chart shows the leveraged RYDEX bull-bear ratio. Although it is well off its 2018 peaks, it remains in nosebleed territory at a factor of 16.4.
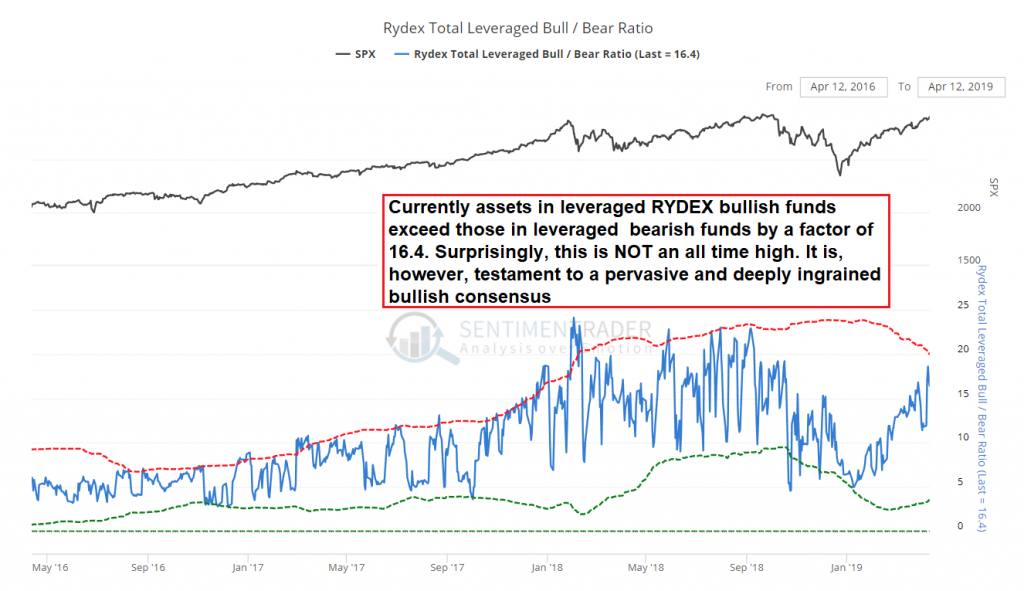
The leveraged RYDEX bull-bear ratio compares assets in leveraged bull and bear funds and is a testament to the intensity of speculation on a rising market. Its all-time low was made in June 2003 at 0.20; in November of 2008, it bottomed at 0.40. Both were quite propitious times to go long equities – the same can probably not be said of the current juncture.
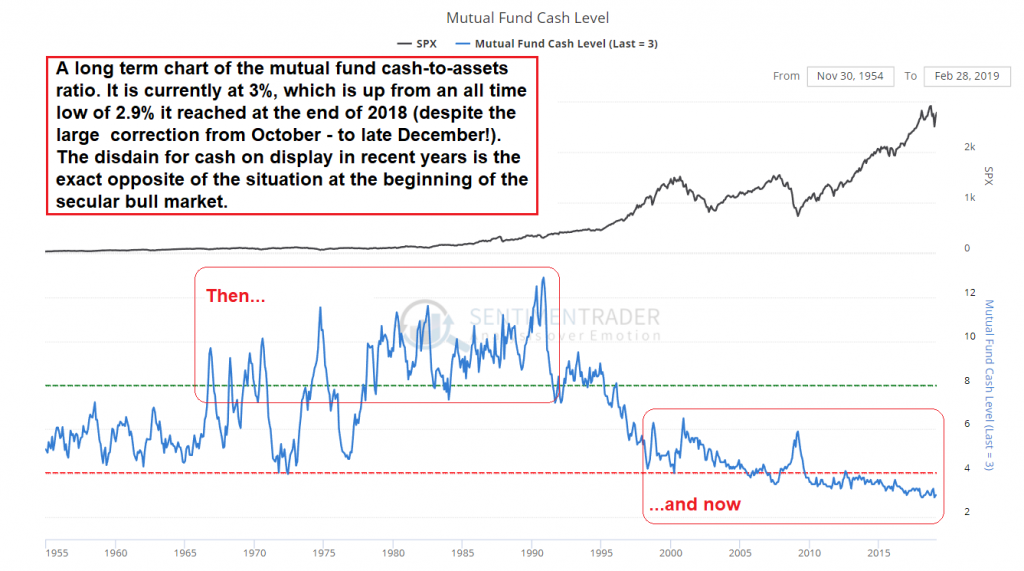
The next chart is a very long term chart of the mutual fund cash-to-assets ratio. In late December 2018, it fell to a new all-time low of 2.9 (i.e., a mere 2.9% of all mutual fund assets were held in cash). In short, not even a rapid and harrowing 20% correction was able to faze fund managers. This shows how deeply ingrained the bullish consensus has become.
Mutual fund cash is at an all-time low compared to total mutual fund assets. This ratio obviously has primarily long term implications; prior to the beginning of the secular bull market, it frequently reached the double-digit territory. The extremely low levels that could be observed since 2005 are historically unprecedented. In part, this can be attributed to low-interest rates, but the main reason is simply that everyone has become convinced that the central bank will always be able and willing to rescue the market when it falters. This is a dangerous attitude.
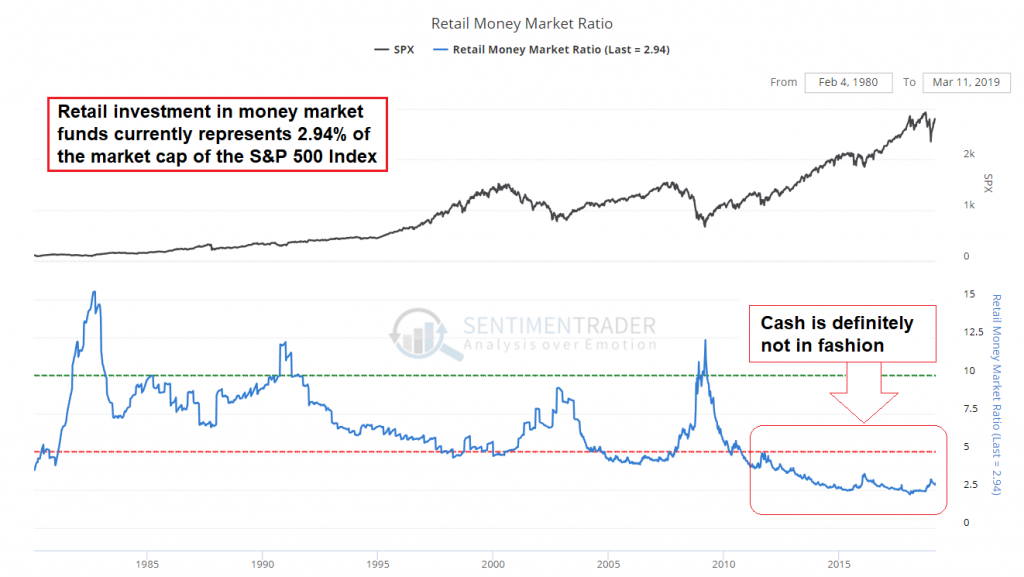
The next chart shows the ratio of assets held in retail money market funds to the market capitalization of the S&P 500 Index. This chart is very similar to the mutual fund cash-to-assets ratio and illustrates that a pervasive and deeply ingrained bullish consensus is just as prevalent among retail investors as it is among fund managers.
Assets held by retail money market funds as a percentage of the market capitalization of the SPX. In recent years this percentage has declined to levels far below previously recorded low points. Evidently, retail investors are not exactly concerned about the market either.
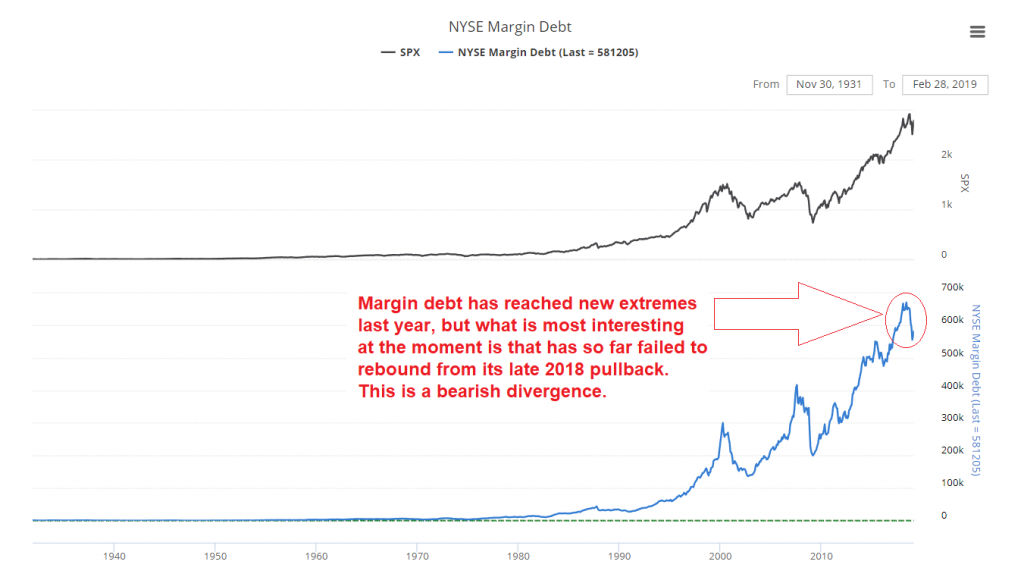
Lastly, we will take a look at margin debt. The first chart shows margin debt in nominal terms.
Apart from the fact that margin debt has also streaked to unprecedented highs in 2018, it has actually failed to rebound in the course of the recent rally. This constitutes a bearish divergence – as several previous major market peaks indicate, margin debt very often (but not always!) tops out before the stock market indexes peak. The years 1937 and 1973 were notable exceptions to this rule, as margin debt peaked with a considerable lag in both cases.
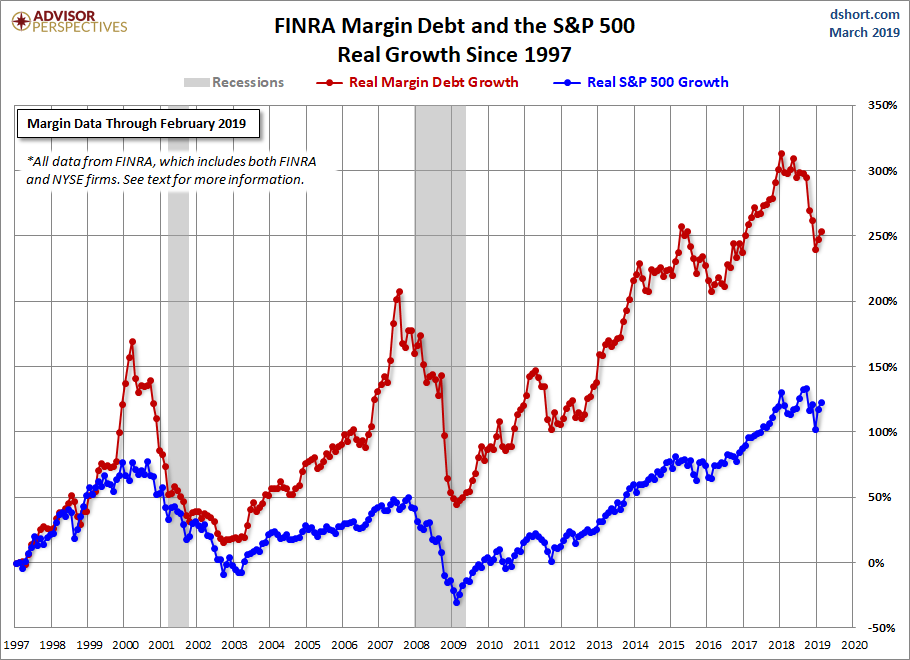
The next chart compares the cumulative growth of margin debt and the value of the S&P 500 Index in real terms (i.e., adjusted for CPI) since 1997.
In real terms margin debt has grown to a far greater extent than the market capitalization of the SPX.
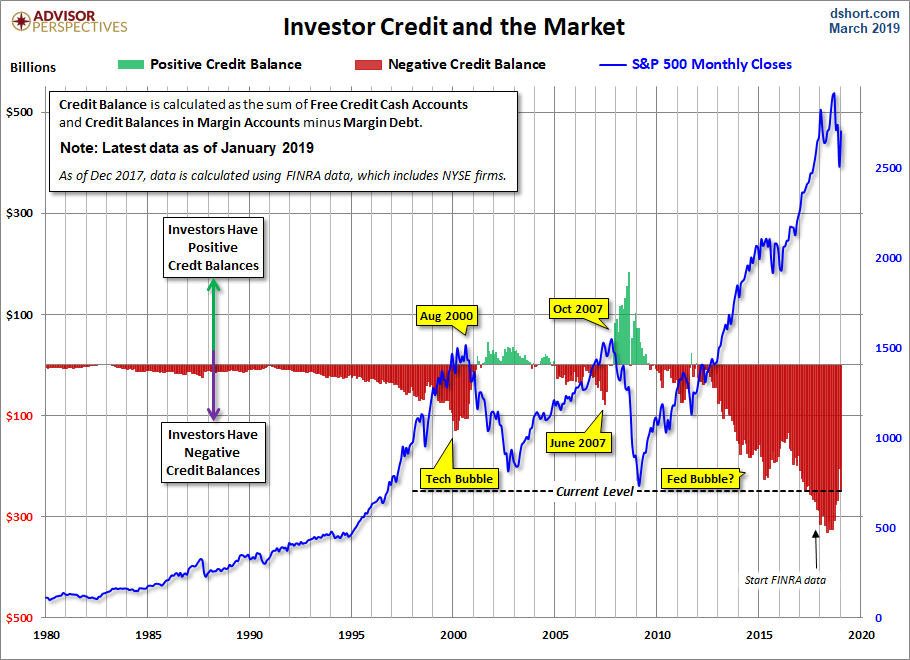
The growth in margin debt represents a considerable threat to the market, as aggregate credit balances held by investors in brokerage accounts are deeply negative (they have slightly improved since 2018, but remain near historic extremes).
Investor credit balances in brokerage accounts remain at a negative extreme.
Obviously, these extremely large negative credit balances will be prone to exacerbating pressure on stock prices once a downturn crosses the thresholds required to trigger margin liquidation. Even though margin clerks haven’t had much to do in recent years, we have little doubt that they remain as merciless as ever.
When the Long Term Becomes the Present
Keynes once famously quipped that “in the long term, we’re all dead” when other economists criticized his policy prescriptions for generating short term gain at the price of severe long term pain. The problem with Keynes’ glib witticism is of course that eventually, the dreaded “long term” becomes our “here and now”.
There are a number of good reasons to be concerned that we are quite close to the point in time when the long-term sentiment and positioning indicators shown above begin to exert their effects. As we pointed out in our recent comparison between today’s market and the late 1920s boom, the technical underpinnings of the recent rally were fairly strong, which normally bodes well for the market in the short term.
However, the monetary backdrop continues to grow ever more hostile, despite the soothing words from the flock of doves at the helm of the Fed. We don’t care much for what they say – what counts is what is actually happening to money supply growth, and the growth rate of TMS-2 (the broad true US money supply) has recently declined to a new 12-year low. We will discuss the monetary backdrop in more detail shortly and provide our best guess as to why the sharp slowdown in money supply growth has seemingly not mattered much to equities until now.

