This week, the Federal Reserve left its overnight lending rate at the zero-bound range of 0.00%-0.25%. The Fed also reasserted its commitment to a wide array of lending and asset purchasing programs via digital money printing.
No surprises there.
There was, however, a bit of a shocker in the mainstream financial media. Specifically, CNBC’s Jim Cramer became irate with those who claim that the Fed is propping up a stock bubble.
“I’m sick and tired of hearing that we’re in a bubble, that the Fed’s over-inflating the price of stocks by printing money to keep the economy moving,” the Mad Money host lamented. “Believe it or not, there’s more to the economy than just the Federal Reserve, and there’s certainly more to the stock market.”
Not everyone agrees with CNBC’s stock-pumper-in-chief, though. Mark Cuban, the enigmatic entrepreneur and “Shark Tank” personality, recently compared the 2000 tech bubble and the 2020 Nasdaq. Mr. Cuban said in an interview (7/20/20), “In some respects, it’s different because of the Fed and the liquidity they’ve introduced. But on a bigger picture, it’s so similar.”
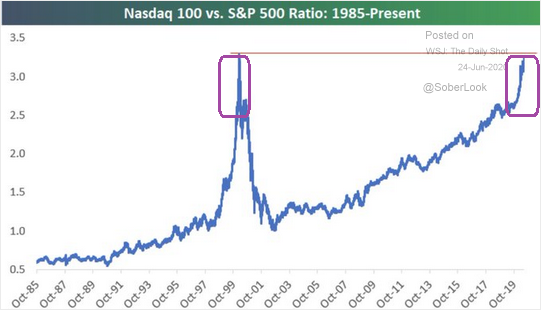
In truth, the similarities between the 2020 stock bubble and the 2000 stock bubble are striking. The price ratio between the NASDAQ 100 (QQQ) and the S&P 500 (SPY) has gone parabolic in much the same way that it did in 1999.
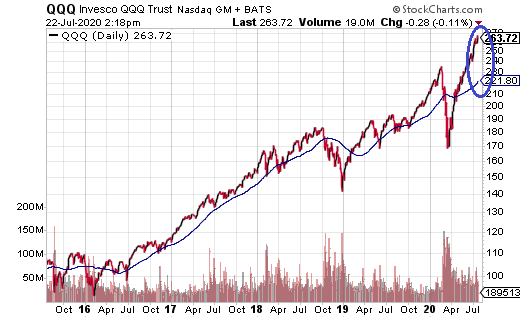
That’s not all. You would have to go back 20 years to the dot-com disaster to find a time when the Nasdaq 100 traded as far above its 100-day moving average as it currently trades.
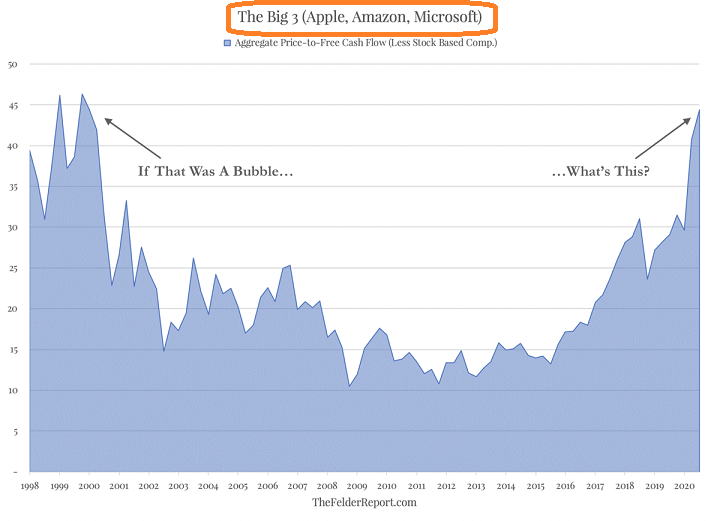
Perhaps ironically, there is complete unanimity when it comes to the notion that the 2000 stock market represented an egregious stock bubble. Yet, as former hedge fund manager Jesse Felder points out, you’re supposed to look the other way here in 2020.
Mr. Cramer is correct that there is more to the economy and more to the stock market than the Fed alone. At least there should be more.
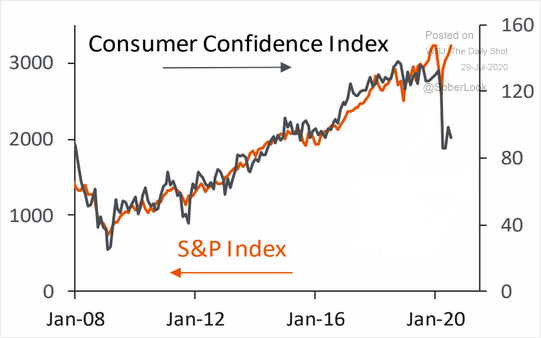
For instance, consumer confidence used to strongly correlate with the movement of the S&P 500. That gauge appears to be broken.
And there was a time when corporate earnings mattered. Considering the uncertainty of corporate earnings in the year ahead, investors “should” be paying around 14x forward earnings per share. Instead, they’re paying 26x.
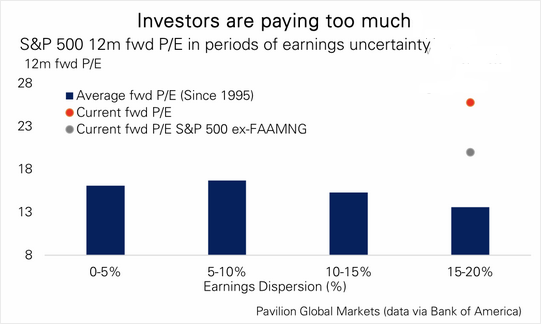
Indeed, we find ourselves looking at Forward P/Es that haven’t been this out of whack since the 2000 stock bubble. And this is as true for the S&P 500 as it is for the Nasdaq.
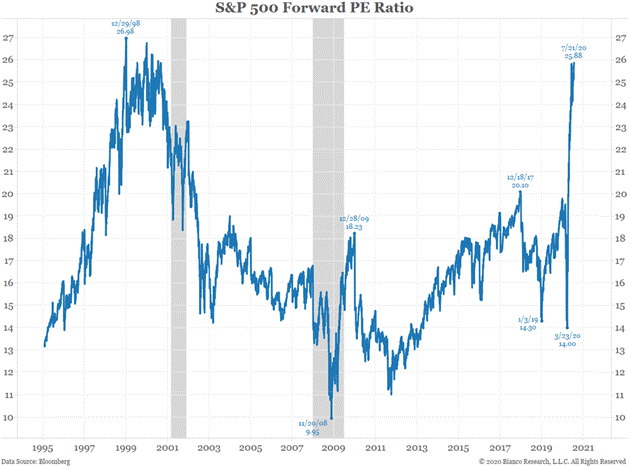
To Cramer’s chagrin, there’s virtually no way to make stock valuations look attractive. Even if one tries to forecast earnings three years forward in time, the hyper-valued nature of today’s stock market is clear-cut.
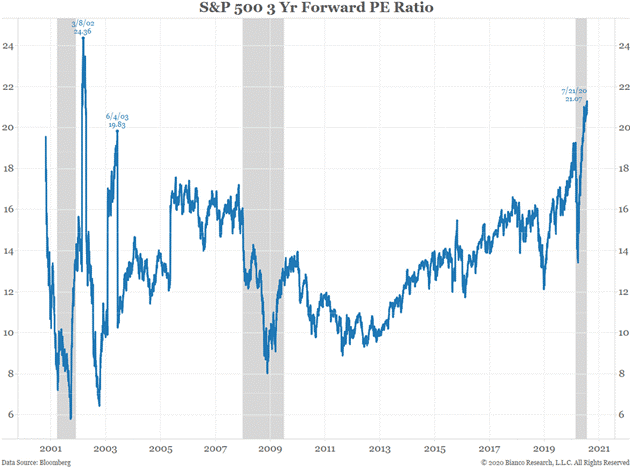
Yes, Mr. Cramer. There’s more to the economy and the stock market than the Federal Reserve. But for the time being, speculation is the name of the game.
Record stock prices when roughly 20% of the labor force (160 million) currently receives jobless benefits? When continuing job claims are on the rise, rather than improving?
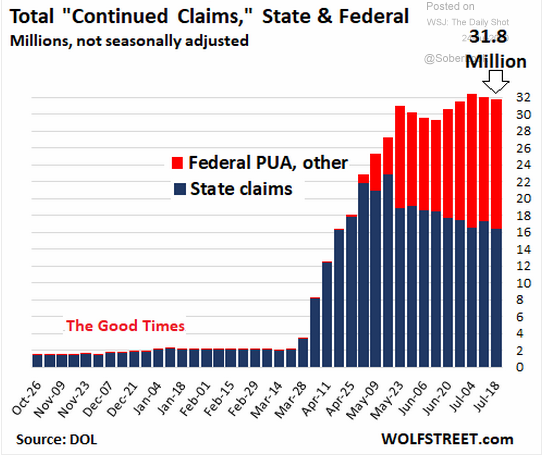
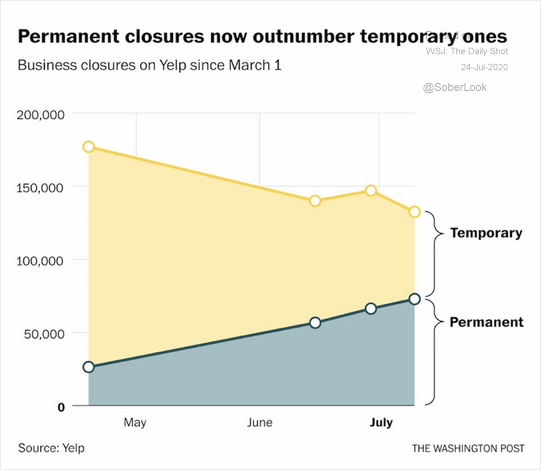
Others would like you to believe that lost jobs will come back quickly. In truth, the rise in permanent business closures imply that the employment road back to full strength will be bumpy.
Jim Cramer is an intelligent person. But he is being disingenuous. The economy itself (GDP) does not justify today’s stock prices, 2021’s stock prices or 2023’s stock prices. Neither do earnings, sales, or cash flow.
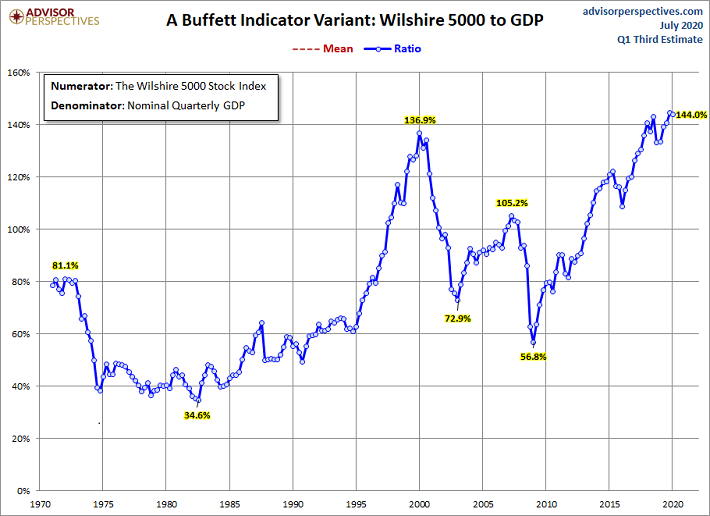
Of course we have a Fed-induced stock bubble. The only question is, how long should you keep pressing your luck?
When it comes to the mega-caps like Facebook (NASDAQ:FB), Amazon (NASDAQ:AMZN), Apple (NASDAQ:AAPL), Microsoft (NASDAQ:MSFT) and Google (NASDAQ:GOOGL), you might want to lighten up a bit. Not forever. But maybe, just maybe, common sense is suggesting to lighten up some.
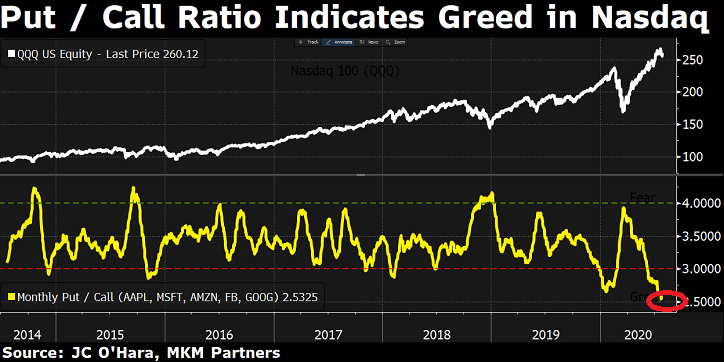
Keep in mind, you can always buy more shares of your favorites down the path. Right now, though, greed for exposure to the Nasdaq 100 (QQQ) has been getting out of hand.
You might also hedge some of your common stock exposure with alternative asset types. Longer-term Treasuries via iShares 10-20 Year Treasury Bond ETF (NYSE:TLH), agricultural commodities via Teucrium Corn (NYSE:CORN) and data center REITs like Equinix (NASDAQ:EQIX) fit the bill.
Note: I would also look to precious metals like gold. At this moment, though, it is worth waiting for pullbacks to increase one’s allocation to SPDR Gold (GLD (NYSE:GLD)), iShares Gold iShares Gold Trust (NYSE:IAU) or Aberdeen Standard Gold (NYSE:SGOL).
