Get 40% Off
These stocks are up over 10% post earnings. Did you spot the buying opportunity? Our AI did 😎Read how

Friday's Healthy Sell-Off Not Enough To Damage Rally

Published 03/02/2015, 03:47 AM
Updated 07/09/2023, 06:31 AM

Friday's GDP data didn't rock the boat too much, and by the close losses were light and inline with profit taking.

The only warning sign was a 'sell' trigger in the NASDAQ Percentage of Stocks Above the 50-day MA. Unusual in that the NASDAQ has been the high flyer of the indices in recent weeks. Breadth metrics for the NASDAQ need to be watched closely should such weakness expand.
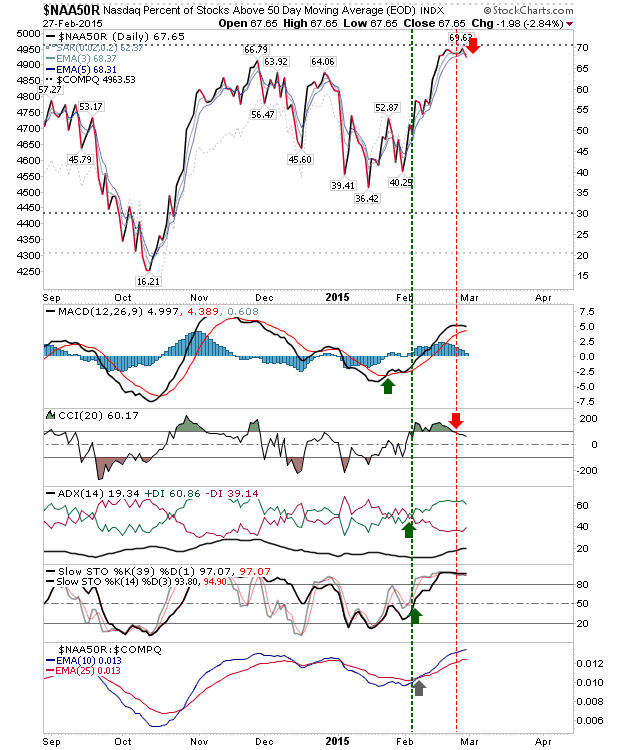
NAA50R (NASDAQ % stocks above the 50 MA) Index Daily Chart


Friday's reversal in the NASDAQ also occurred at the 10% moving average envelope to the 200-day MA. A similar occurrence in November marked a high of an eventual 2 1/2 month consolidation, and was followed by a period of weakness which lasted a couple of weeks
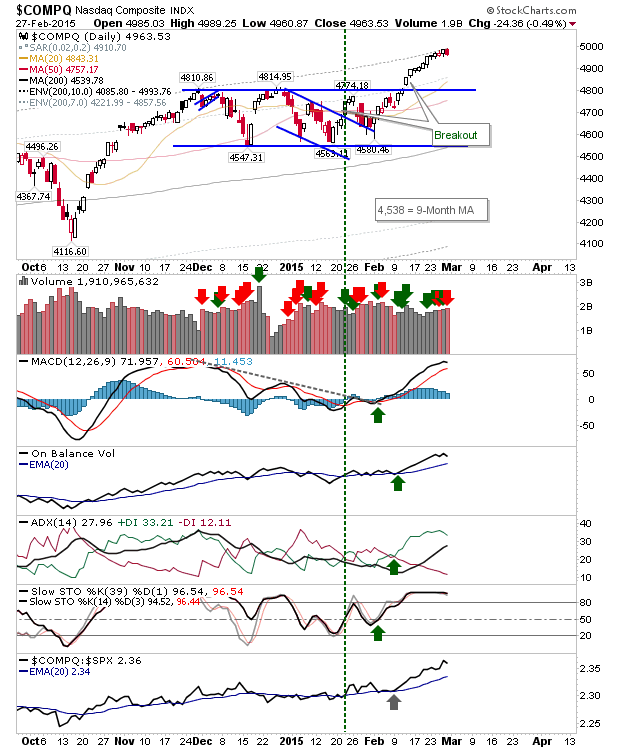
NASDAQ Composite Daily Chart


The S&P 500 lost a handful of points, but not enough to hurt it.
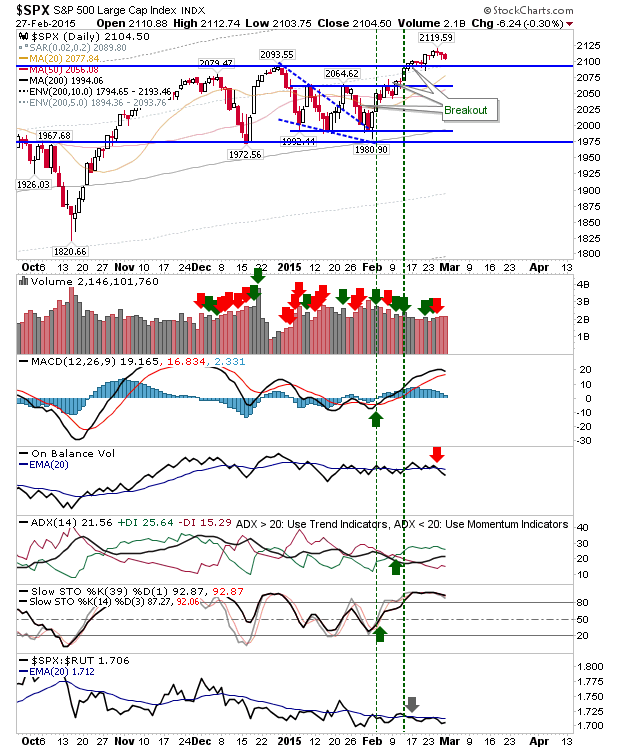
SPX Daily Chart


The Russell 2000 also enjoyed a healthy sell-off. Not enough to damage the rally, but enough to shake some weak hands. Plenty of support available below should selling pick up.
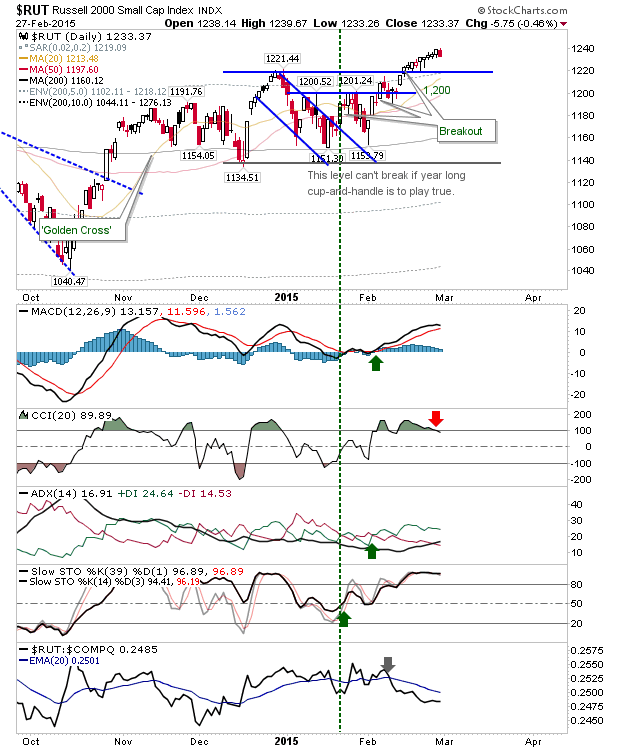
Russell 2000 Daily Chart


Hopefully, today will be more exciting.

Latest comments

Risk Disclosure: Trading in financial instruments and/or cryptocurrencies involves high risks including the risk of losing some, or all, of your investment amount, and may not be suitable for all investors. Prices of cryptocurrencies are extremely volatile and may be affected by external factors such as financial, regulatory or political events. Trading on margin increases the financial risks.
Before deciding to trade in financial instrument or cryptocurrencies you should be fully informed of the risks and costs associated with trading the financial markets, carefully consider your investment objectives, level of experience, and risk appetite, and seek professional advice where needed.
Fusion Media would like to remind you that the data contained in this website is not necessarily real-time nor accurate. The data and prices on the website are not necessarily provided by any market or exchange, but may be provided by market makers, and so prices may not be accurate and may differ from the actual price at any given market, meaning prices are indicative and not appropriate for trading purposes. Fusion Media and any provider of the data contained in this website will not accept liability for any loss or damage as a result of your trading, or your reliance on the information contained within this website.
It is prohibited to use, store, reproduce, display, modify, transmit or distribute the data contained in this website without the explicit prior written permission of Fusion Media and/or the data provider. All intellectual property rights are reserved by the providers and/or the exchange providing the data contained in this website.
Fusion Media may be compensated by the advertisers that appear on the website, based on your interaction with the advertisements or advertisers.
© 2007-2024 - Fusion Media Limited. All Rights Reserved.