
I Love junk bonds!
Two For One
They're awesome total return tools when the trend is up while they provide quality "leading signals" for the macro economy. Speaking of total return, the chart below illustrates that the Junk Bond Total return index is up nine-fold since 1990.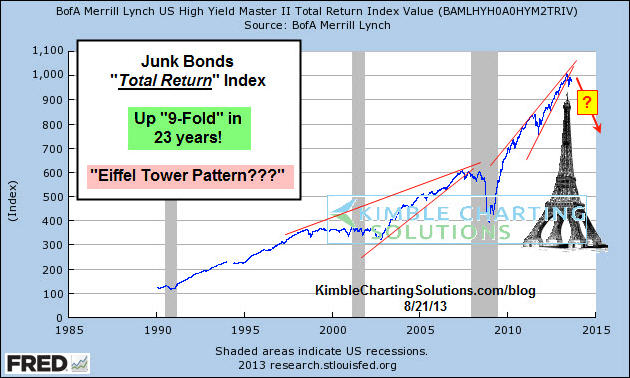
Rising Wedge?
Is a bearing rising wedge in place in the Total Return Index? Is a bearish and dangerous Eiffel-Tower pattern in place too?
The chart below shows that two of the largest Junk Bond ETF's could be at very important levels right now. JNK on the left is testing support after breaking lower out of a bearish rising wedge and HYG is actually breaking support.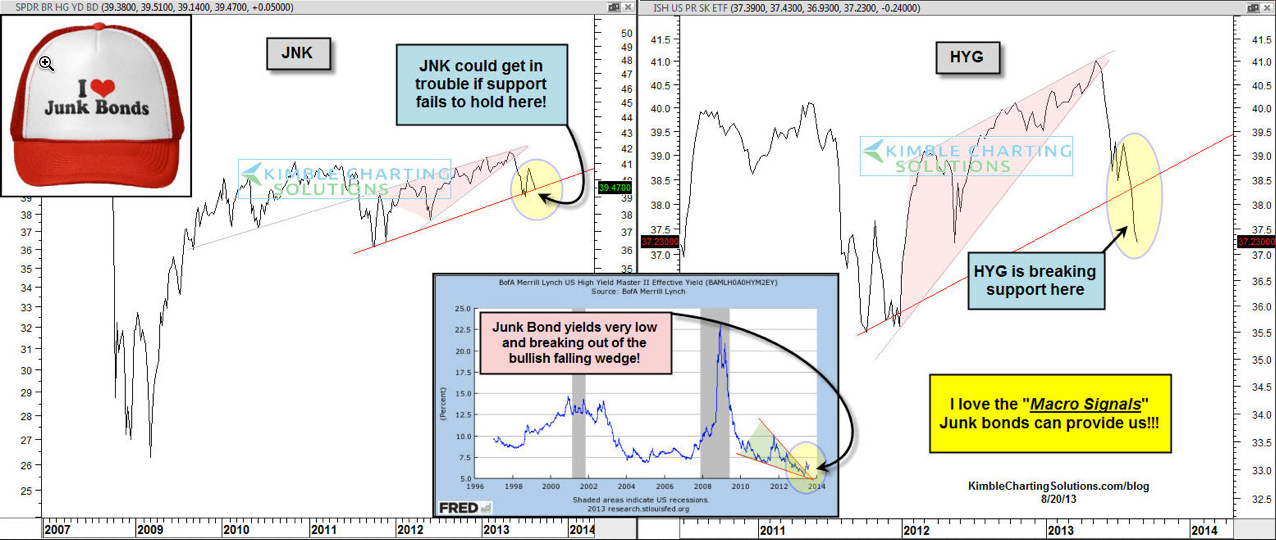
Historically Low
The lower inset chart reflects that junk bond yields are near the lowest in history and have formed a bullish falling wedge, which suggested higher yields should take place and push junk bond prices lower.
Lower junk bond prices are often followed by declines in the stock market. Use these assets to help with your portfolio construction and improve your overall returns.
- English (UK)
- English (India)
- English (Canada)
- English (Australia)
- English (South Africa)
- English (Philippines)
- English (Nigeria)
- Deutsch
- Español (España)
- Español (México)
- Français
- Italiano
- Nederlands
- Português (Portugal)
- Polski
- Português (Brasil)
- Русский
- Türkçe
- العربية
- Ελληνικά
- Svenska
- Suomi
- עברית
- 日本語
- 한국어
- 简体中文
- 繁體中文
- Bahasa Indonesia
- Bahasa Melayu
- ไทย
- Tiếng Việt
- हिंदी
Junk Bubble About To Break? Critical Levels At Hand
Published 08/21/2013, 11:01 AM
Updated 07/09/2023, 06:31 AM
Junk Bubble About To Break? Critical Levels At Hand
Latest comments
Install Our App
Risk Disclosure: Trading in financial instruments and/or cryptocurrencies involves high risks including the risk of losing some, or all, of your investment amount, and may not be suitable for all investors. Prices of cryptocurrencies are extremely volatile and may be affected by external factors such as financial, regulatory or political events. Trading on margin increases the financial risks.
Before deciding to trade in financial instrument or cryptocurrencies you should be fully informed of the risks and costs associated with trading the financial markets, carefully consider your investment objectives, level of experience, and risk appetite, and seek professional advice where needed.
Fusion Media would like to remind you that the data contained in this website is not necessarily real-time nor accurate. The data and prices on the website are not necessarily provided by any market or exchange, but may be provided by market makers, and so prices may not be accurate and may differ from the actual price at any given market, meaning prices are indicative and not appropriate for trading purposes. Fusion Media and any provider of the data contained in this website will not accept liability for any loss or damage as a result of your trading, or your reliance on the information contained within this website.
It is prohibited to use, store, reproduce, display, modify, transmit or distribute the data contained in this website without the explicit prior written permission of Fusion Media and/or the data provider. All intellectual property rights are reserved by the providers and/or the exchange providing the data contained in this website.
Fusion Media may be compensated by the advertisers that appear on the website, based on your interaction with the advertisements or advertisers.
© 2007-2024 - Fusion Media Limited. All Rights Reserved.