Get 40% Off
👀 👁 🧿 All eyes on Biogen, up +4,56% after posting earnings. Our AI picked it in March 2024.
Which stocks will surge next?
Unlock AI-picked Stocks

JP Morgan Breaks Above 157.00 Ahead Of Earnings

Published 07/13/2021, 07:06 AM
Updated 07/09/2023, 06:31 AM

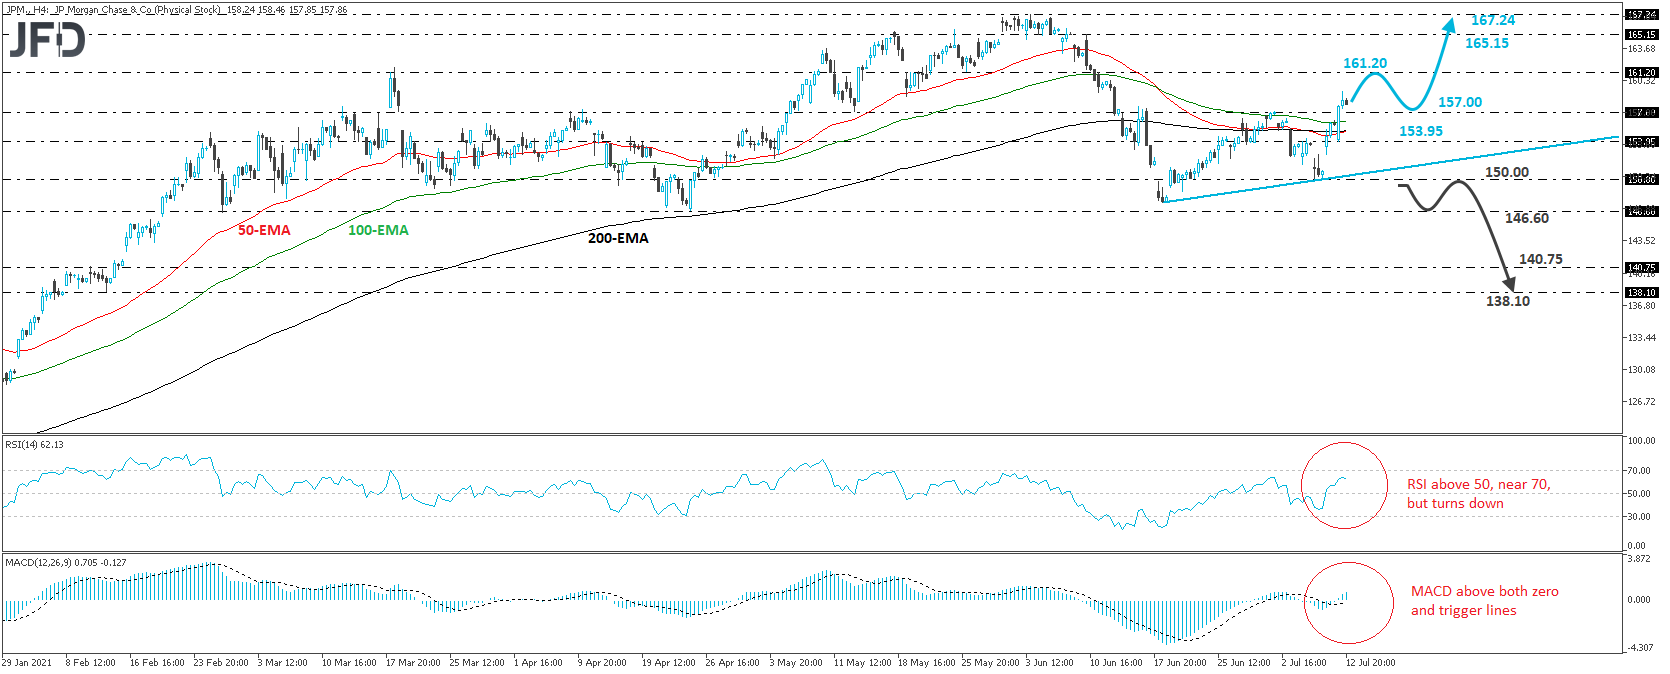
JPMorgan  (NYSE:JPM) traded higher on Monday, breaking above the peak of July 1, at 157.00, thereby confirming a forthcoming higher high. Besides that, the stock has already started forming lower highs, as marked by the upside line taken from the low of June 18, and thus, we would consider the short-term picture to be positive.

Today, ahead of the US opening bell, the bank reports its second-quarter earnings, and decent results may encourage further buying for the next few days. We believe that the break above 157.00 may have opened the way towards the 161.20 zone, defined as a resistance by the high of June 11 and the inside swing low of May 26. If investors are not willing to stop there, then we could see the advance extending towards the 165.15 area, marked by the high of June 10. Slightly higher lies the stock’s record high, at 167.24, hit on June 3, which could also get tested.

Shifting attention to our short-term oscillators, we see that the RSI lies above 50, near 70, but it has already turned down, while the MACD stands above both its zero and trigger lines. Both indicators detect upside speed, but the fact that the RSI has turned down makes us careful over a possible corrective setback before the next leg north. Perhaps such a retreat may occur in the aftermath of the earnings on a potential sell-the-fact market response.

Nonetheless, in order to abandon the bullish case, we would like to see a drop below the round figure of 150.00, also marked by last Thursday’s low. This will confirm a forthcoming lower low on both the 4-hour and daily charts, and may initially target the 146.60 zone, which provided support on Feb. 26 and Apr. 23. If investors are not willing to jump into the action near that zone this time around, then we could see the slide extending towards the 140.75 area, or the 138.10 hurdle, marked by the inside swing high of Feb. 10 and the low of the day after, respectively.
JPMorgan and Chase Co stock 4-hour chart technical analysis

3rd party Ad. Not an offer or recommendation by Investing.com. See disclosure here or remove ads .

Latest comments

Risk Disclosure: Trading in financial instruments and/or cryptocurrencies involves high risks including the risk of losing some, or all, of your investment amount, and may not be suitable for all investors. Prices of cryptocurrencies are extremely volatile and may be affected by external factors such as financial, regulatory or political events. Trading on margin increases the financial risks.
Before deciding to trade in financial instrument or cryptocurrencies you should be fully informed of the risks and costs associated with trading the financial markets, carefully consider your investment objectives, level of experience, and risk appetite, and seek professional advice where needed.
Fusion Media would like to remind you that the data contained in this website is not necessarily real-time nor accurate. The data and prices on the website are not necessarily provided by any market or exchange, but may be provided by market makers, and so prices may not be accurate and may differ from the actual price at any given market, meaning prices are indicative and not appropriate for trading purposes. Fusion Media and any provider of the data contained in this website will not accept liability for any loss or damage as a result of your trading, or your reliance on the information contained within this website.
It is prohibited to use, store, reproduce, display, modify, transmit or distribute the data contained in this website without the explicit prior written permission of Fusion Media and/or the data provider. All intellectual property rights are reserved by the providers and/or the exchange providing the data contained in this website.
Fusion Media may be compensated by the advertisers that appear on the website, based on your interaction with the advertisements or advertisers.
© 2007-2024 - Fusion Media Limited. All Rights Reserved.