We expect a stronger H219 from John Laing Group Plc (LON:JLG) after a mixed performance in H1, when NAV growth was restrained by asset write downs. Although we have reduced our FY19 estimate for NAV per share to 353p (+9% year-on-year), we believe the long-term outlook for the business remains favourable given the global requirement for infrastructure investment. JLG’s shares now stand at a small discount to peer group averages, offering an attractive entry point for potential investors.

H119 results: Growth despite asset write downs
The H119 results were mixed and below market expectations. The all-important NAV per share rose only modestly (+0.6%) in H119, from 323p at 31 December 2018 to 325p at 30 June 2019. NAV growth was restricted by asset write downs to Australian (13p/share) and European (11p/share) renewable assets. The write down of the valuation of the renewable assets was partly offset by a strong performance in value enhancements from its existing projects (16p/share) that, along with the ‘embedded’ sources of value creation including a reduction in construction risk premiums and the unwinding of discounting (18p/share), contributed significantly to the fair value movement of the portfolio (35p/share). The other important benchmark, the DPS, increased 2.2% to 1.84p per share (from 1.80p per share in H118), in line with our forecasts.
Outlook remains positive
Despite the mixed first half, JLG remains confident for FY19. We expect much stronger growth in NAV per share in the second half of the year, with no reoccurrence of the H1 asset write downs, a much smaller dividend payment in H2, no further contributions to the John Laing Pension Fund and further value enhancements. However, following the results, we have revised our forecasts to reflect the reduction in the value of some of the renewable assets seen in H1. Our revised forecast for FY19e NAV per share of 353p (previously 360p) represents growth of 9% on the FY18 figure of 323p. Although the project pipeline has been reduced (from £2.4bn to £2.1bn) to reflect a more cautious attitude towards renewable energy investment, we believe the global requirement for new infrastructure remains strong and JLG appears well placed to exploit this trend.
Valuation: 10% premium to NAV per share
Share price weakness following the H1 results now places JLG on a c 9% premium to its last reported NAV per share, slightly below peer group average of 14%. This provides a more attractive entry point for investing in the shares.
Business description
John Laing is an originator, active investor in and manager of greenfield infrastructure projects. It operates internationally and its business is focused on the transport, energy, social and environmental sectors
Investment summary
Company description: Infrastructure investor
JLG originates, invests in and manages portfolios of infrastructure projects. The business operates in selected geographical markets – Asia-Pacific, North America, Europe and more recently Latin America – and is focused on the transport, environmental and social sectors. At 30 June 2019, the investment portfolio was valued at £1,535m. The assets are split between projects under construction, primary (c 58%), operational projects, secondary (c 41%) and JLG’s holding in John Laing Environmental Assets Group (JLEN) (1%).
Valuation: Premium rating
JLG’s share price has performed strongly in recent years but following recent weakness it now stands at a c 9% premium to its last reported NAV of 325p/share. This compares to an average premium of c 4% since the beginning of 2017 and recent highs of 20%. JLG’s peer group trades on an average premium of c 14%. With the prospect of a stronger H2, a positive macro environment for infrastructure investment and a less challenging valuation, JLG’s shares appear attractive at current levels.
Financials: Forecast continuing NAV growth

Despite a mixed H119, given a favourable macro environment for infrastructure investment and JLG’s experience and market positioning, we believe it should be able to continue to achieve growth in NAV per share and DPS. Our key assumptions are set out in Exhibit 1. The details underlying our assumptions can be found in the ‘Financials’ section of this report.
Sensitivities: Discount rate, foreign exchange and power prices
Discount rates: a 0.25% rise in discount rates would reduce the value of the investment portfolio by £56m. A 0.25% reduction in the discount rate applied would increase the valuation by c £59m.
Foreign exchange: a +/- 5% movement in sterling would increase or decrease the portfolio valuation by c £57m.

Power prices: a 5% increase/decrease in power price forecasts is estimated to increase/decrease portfolio value by c £30m.
Infrastructure investor with proven track record
JLG’s business model
JLG’s business model is based on its investment origination (primary investment) and asset-management capabilities. Initial value is created by the start of greenfield infrastructure projects, often as part of a consortium. The assets, which are diversified by industry type and geography, should offer long-term and predictable cashflows and are held in special purpose vehicles. As the assets move through the construction phase, their value increases as their risk-profile reduces.
While the assets remain in the construction phase, they reside in the primary portfolio but on starting operation they are transferred to the secondary investment portfolio. Assets can be held to maturity or sold to infrastructure investors. JLG seeks to create value from this process by maintaining an attractive ‘yield shift’. JLG defines the ‘yield shift’ as the difference between the hold-to-maturity internal rate of return (IRR) at the time of original investment in a greenfield project and the discount rate applicable to that project once it has begun operations. JLG acknowledges there has been pressure in recent years on the hold to maturity IRRs but stresses it has been able to maintain the ‘yield shift’ as a result of the buoyant demand for secondary assets (and hence lower discount rates). The company actively manages the portfolio with the aim of reducing risks, particularly in the construction phase and increasing value by enhancing each project’s cash flow via efficiency improvements (eg working capital) and cost optimisation (eg management costs, insurance costs or via bulk purchasing) and from de-risking the projects.
JLG’s strategy
JLG’s strategy is to create value for shareholders via growth in the NAV per share and dividends. In 2018 JLG achieved a 15% growth in NAV per share, or 18.2% if dividend payments are added. JLG seeks to deliver on its strategic objectives by growing the volume of primary investment over the medium term and actively managing its investment portfolio with a view to driving value enhancement at the project level. JLG’s key markets are North America, Europe and Asia Pacific and it invests in sectors such as transport, social infrastructure and environmental (including renewable energy). In Europe and Australia, however, JLG recently announced a halt to further renewable investment following recent asset write-downs although it will continue to recycle capital already invested in renewable assets in the US.
JLG’s track record

JLG’s business model has proved effective in generating returns for shareholders. In FY18 the NAV per share rose by 15% to 323p and the dividend per share was increased by 6.5% to 9.5p per share. There was an 18.2% increase in NAV per share, including dividends paid in 2018.
Resurgent growth expected in H219
Management do not expect the write down of renewable assets that marred H1 to reoccur in H2 and we expect the underlying strength of JLG’s business to lead to a year-end NAV per share of 353p (+9%) for FY19. Although JLG has adopted a more cautious attitude to renewable investment in Europe and Australia leading to a reduction in the investment pipeline to £2.1bn, the pipeline still represents over 6x JLG’s projected investment profile. The global need for infrastructure investment remains significant and JLG is well placed to capitalise on this opportunity.
H119 results
The H119 results from JLG were somewhat mixed. The all-important NAV per share rose only modestly (+0.6%) in H119, from 323p at 31 December 2018, to 325p at 30 June 2019. This growth compared to a consensus assumption (as shown on JLG’s website) for year-end FY19 of 358p (+10.8%) prior to the release of the results. The principal components in the NAV movement are shown in Exhibit 4 and demonstrate clearly the negative impact of asset write downs relating to Australian (13p) and European renewable assets (11p). The write down of the valuation of the renewable assets was offset to a degree by a strong performance in value enhancements from its existing projects (16p) that, along with the ‘embedded’ sources of value creation including a reduction in construction risk premia and the unwinding of discounting (18p), contributed significantly to the fair value movement of the portfolio. The other important benchmark, the DPS, increased 2.2% to 1.84p per share (from 1.80p per share in H118) in line with our forecasts.
In Australia three of JLG’s renewable energy assets (representing 11% of the total portfolio as at 31 December 2018) were adversely affected by the annual marginal loss factors (transmission and distribution losses) published by the Australian Energy Market operator (AEMO) for the year July 2019–2020. The AEMO forecast, however, only relates to one year and JLG commissioned an external adviser to conduct a longer-term study that resulted in the decision to write down the value of the assets by £66m. Meanwhile, JLG continues to work on other project enhancements across its Australian renewable portfolio and has submitted proposals to the AEMO that, if successful, could mitigate part of the impact of the ruling. The asset write down in Europe related to renewable assets in Germany and Ireland where JLG has experienced low levels of wind. Accordingly, the long-term forecasts for output from these assets has been reduced with a concomitant reduction in the value of the assets.
The impact of the asset write down also affected PBT, which fell to £35m in H119 versus £175m in H118. Aside from the asset write down, the year-on-year comparison is further distorted by the large gain (£87m) on the InterCity Express Programme Phase 1 project, which occurred in H118.

JLG sold three assets in H119 with a total value of £131m (H118 two investments worth £242m), while the rate of investment in new projects was somewhat sluggish, with only £7m invested during the period (H119 £37m). However, post the period end, JLG agreed a further £75m (for 75%) investment in a US wind farm and agreed to acquire 30% of the Ruta del Cacao road project in Colombia for approximately £62m; the Ruta del Cacao investment marks JLG’s first investment in Colombia. JLG remains confident it will be able to meet its guidance for investment commitments of approximately £1.0bn over the three-year period 2019–2021, with realisations expected to be broadly in line with investment.
The pipeline of business opportunities of c £2.1bn remains healthy (our expectation of annual investment of c £330m) but showed a notable decline from the £2.4bn recorded at the end of 2018. The principal reason for the decline was the more cautious attitude towards future investment in renewables, particularly in Europe and Australia where new wind and solar investments are on hold (for details see Exhibit 10). Interestingly, the pipeline for public-private partnership (PPP) assets increased by over 300m to £1.9bn.
FY19 outlook: A stronger H2 expected
Despite the mixed first half, JLG remains confident for FY19 as a whole and has stated that its outlook for the year remains unchanged. We expect a much stronger second half, with no reoccurrence of the H1 asset write downs, a much smaller dividend paid in H2, no further contributions to the John Laing Pension Fund and further value enhancements. However, following the results, we have revised our forecasts to reflect the reduction in the value of some of the renewable assets. The details of our forecasts are set out in the financial section of this report, but the principal changes are shown in Exhibit 2. It is important to note that despite the changes in our forecasts, NAV per share for FY19 still represents growth of 9% on the FY18 figure of 323p.
Portfolio analysis
JLG’s portfolio remains well diversified by geography, asset type and stage of development; Exhibits 5 to 8 show the split of the investment portfolio. It is worth pointing out that JLG no longer provides a breakdown of assets by geography, which separately discloses the UK, but Europe including the UK now accounts for 37% (similar to FY18 year-end). Asia Pacific and North America together account for c 62% of the total portfolio whereas as recently as 2014 the two regions combined accounted for only 15% of the total portfolio. Since the year end, primary assets have increased their share of the total portfolio value from 56% to 58%. Environmental assets, including renewable energy, now account for 35.7% of the portfolio (H118) compared to 44.6% at FY18. The reduction in the share of the environmental sector can be explained by write downs, the increase in the value of other parts of the portfolio and the disposal of two US wind farms in H119.
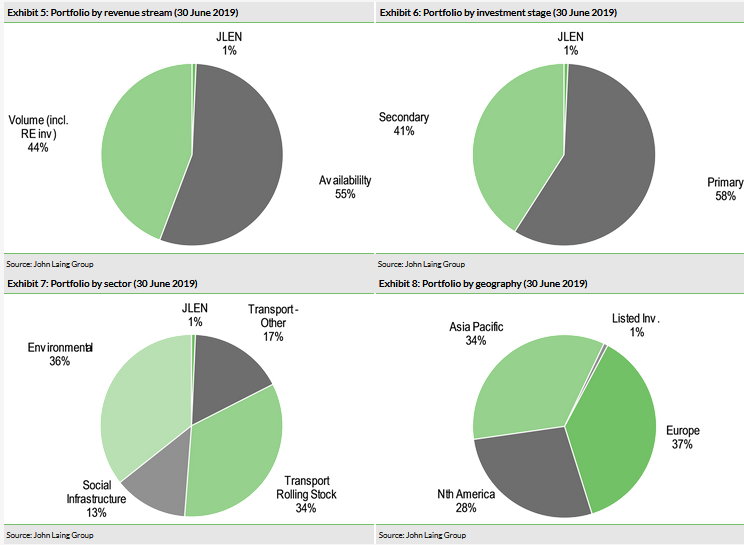
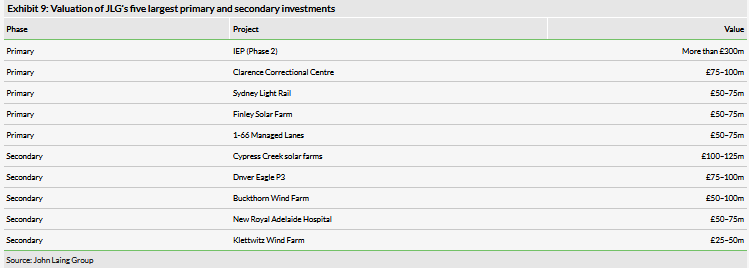
Exhibit 9 shows JLG’s largest investments in the primary and secondary asset portfolio and highlights the importance of IEP (Phase 2), with a valuation in excess of £300m (c 20% of the total portfolio valuation of £1,535m). IEP Phase 2 began public service in May and so far 18 out of 65 trains have been accepted. The project is expected to conclude by the end of the current year and we expect JLG to move rapidly to market the asset to secondary investors. Of the top 10 investments, only IEP Phase 2 is domiciled in the UK. In total the five largest investments account for 40.4% of the total portfolio value, versus 38.4% at FY18.
Long-term outlook
The macro factors that we have identified previously, namely population growth, urbanisation and environmental pressures, continue to provide a positive investment environment for JLG. Management also believes increasing concern with urban air quality will lead to additional investment opportunities. The reduction in infrastructure investment immediately after the financial crash of 2008 merely intensified the requirement for investment.
Figures produced by the G20 (Global Investment Hub, GIH) group of nations indicate there is a need to increase the rate of infrastructure expenditure globally. Estimates produced by GIH indicate that, on current trends, infrastructure expenditure for 2016–2040 is likely to be in the region of US$79trn, versus a requirement of US$94trn, a shortfall of c US$15trn. Geographically, the biggest shortfall (and therefore opportunity) is expected to occur in the Americas and Asia whereas from a sector perspective, road (US$8.0trn) and energy (US$2.9trn) are expected to account for the largest proportion of the shortfall. These identified trends appear in line with recent developments in JLG’s portfolio.
The extent of the investment opportunity can also be gauged by the size of JLG’s investment pipeline, which has grown rapidly in recent years (CAGR 2014–18 12.3%). Although figures for June 2019 of £2,058m represent a decrease of c 13% over the £2,373m recorded in December 2018, this reflects a more cautious attitude towards investment in renewable assets (see Exhibit 10). JLG has placed further renewable investment on hold, pending a resolution to the uncertainties it is facing in Europe and Australia – either asset sales providing a valuation benchmark or a positive outcome to the current discussions with the Australian regulatory authority. In the US, investment in renewables will be confined to the recycling of capital. However, despite the reduction in renewable opportunities, the PPP pipeline continued to grow and the overall pipeline remains equivalent to around six years’ worth of investment at JLG’s current guidance.
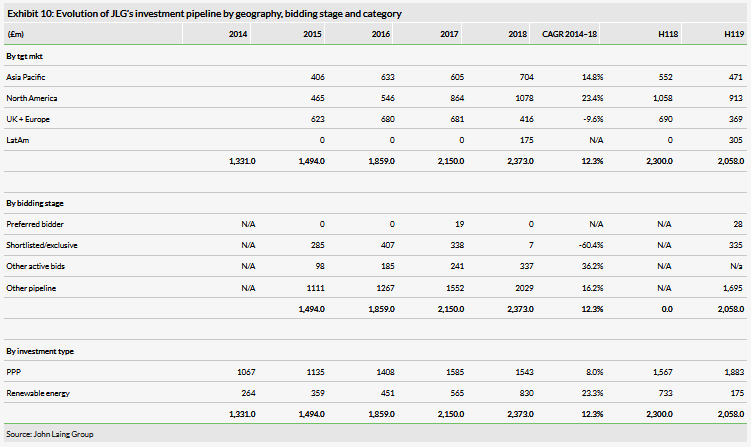
Two long-term growth trends are apparent. First the relative decline of Europe (particularly driven by the UK) juxtaposed by the rise of Asia Pacific and North America as potential locations for investments. Secondly, in the period 2014–2018, a more rapid rise in renewable energy relative to PPP investment opportunities can be observed. JLG’s shift in investment strategy away from renewables can clearly be seen in H119.
As we have noted, JLG remains confident of the outlook and will continue to explore new geographies (see recent in investment in Ruta del Cacao) and sectors (Cable Networks, Electric Vehicles). JLG’s guidance remains for investment commitments of approximately £1.0bn over the three-year period 2019–2021, with realisations expected to be broadly in line with investment commitments. JLG has a large pipeline of secondary assets ready for marketing and points to substantial firepower at the disposal of potential investors in secondary assets that it believes stands at over US$172bn following significant fund raising in 2018. Although some of this new money will seek investment opportunities in primary assets, the overwhelming majority appears destined for secondary assets, fuelling strong demand and allowing JLG to continue to find attractive risk-adjusted returns.

Exhibit 11 shows investment commitments, actual cash invested and portfolio realisations over 2016–18.
North America

As we have shown, the evolution of the pipeline and the composition of the portfolio itself demonstrate significant growth in the proportion of business located in the US. However, the extent of the investment opportunity remains significant. Figures produced by the GIH specifically on the US market indicate that, on current trends at least, the US is still failing to invest sufficiently rapidly to fulfil its needs. The GIH estimates that, over 2016–40, the US will spend in total c US$8.5trn, compared to a requirement of US$12trn (an investment shortfall of US$3.5trn).

Additional analysis carried out by GIH indicates the two sectors with the largest requirement for expenditure are roads and electricity, with the most significant gap in terms of projected investment expenditure versus needs being in the road category (Exhibit 13). Separately, the US government body, the Energy Information Administration, projected in its ‘Energy Outlook 2018’ further growth in installed renewable capacity, which it estimates will rise from 191GW in 2016 to 408GW by 2050 (CAGR of 2.1%). Renewable investment is scheduled to outstrip investment in all other forms of electricity generation assets apart from diurnal storage, which is expected to grow at over 13% (CAGR) and is an area, along with broadband, that JLG is evaluating.
These projections reflect JLG’s own investment strategy in the US, which has thus far been skewed towards the transport and energy sectors. JLG will continue to pursue investment opportunities closely related to its existing business model including, telecommunications and electricity storage.
Investment management services
In recent years JLG has earned revenue from providing investment management services to John Laing Infrastructure Fund (JLIF) and JLEN via JLCM. The revenue generated is calculated as a percentage of the assets under management and is equivalent to c 1% of year-end funds under management. In FY18 JLG generated £18.2m from external investment management services versus £16.7m in FY17. However, we expect this source of revenue to decline after recent corporate transactions.
In October 2018 Dalmore Capital and Equitix Investment Management completed the acquisition of JLIF. The acquiring consortium subsequently gave 12 months’ notice to terminate the investment advisory agreement between JLIF and JLCM. Separately, in June 2019 JLG announced it had reached agreement with Foresight Group for the sale of the investment advisory agreement between JLCM and JLEN. The sale will involve the transfer of c 14 employees. The sale of the investment advisory agreement between JLCM and JLEN to Foresight will mark the end of JLG’s provision of external investment management services and accordingly JLG will generate no revenue from this source beyond FY19.
Management
Will Samuel replaced Phil Nolan as chairman in May 2018 following the AGM, having joined the board as chairman designate in December 2017. Andrea Abt also joined as a non-executive director after the 2018 AGM. At the 2019 AGM Patrick O’D Bourke stepped down as group finance director, having served in that role since 2011 and was replaced by Luciana Germinario. Luciana was previously chief financial officer for Eight Roads, the principal investment division of Fidelity International and before that held several finance roles within General Electric (NYSE:GE). Olivier Brousse remains chief executive officer (since 2014). In addition to Will Samuel, five other non-executive directors sit on the board of the company.
Sensitivities
The investment portfolio remains the chief store of value within JLG and the principal determinant of value remains largely unchanged. Below we recap and update on the most important drivers of value.
The portfolio valuation (and hence the NAV) is sensitive to the forecast of cash flows, tax rates and regulation of each individual project. A reduction in the construction of infrastructure projects (primary investment), or in the appetite of the secondary market for the acquisition of operational assets, would pose a threat to JLG’s business model. The portfolio valuation is also sensitive to discount rates, power prices and foreign exchange rates, which we examine separately below.
Discount rate: JLG has stated that a 0.25% rise in the discount rate used in the DCF valuation of its projects, versus the weighted average discount rate of 8.3% as at 30 June 2019 (8.6% 30 June 2018), would reduce the value of the investment portfolio by £56m. A 0.25% reduction in the discount rate applied would increase the portfolio value by c £59m.
Foreign exchange: c 74% of JLG’s investment portfolio is invested in currencies other than sterling (A$, NZ$, US$, €). The portfolio is therefore sensitive to the sterling exchange rate and according to JLG, a ± 5% movement in sterling would decrease/increase the portfolio valuation by c £57m.
Power price forecasts/output: JLG has stated that a 5% increase/decrease in power price forecasts is estimated to increase or decrease the total portfolio valuation by c £30m.
Our projected DPS payment is, in part, based on a forecast for the special payment, which in turn is dictated by investment realisations in the relevant period. An increase in investment realisations in FY19, from £333m to £400m for example, would increase our forecast for the special dividend from 4.60p to 5.53p, but would reduce the forecast NAV per share by c 1p.
The management of JLG believes its business model is robust enough to weather any potential short-term disruption arising from Brexit. Continuing weakness of sterling as a potential consequence of Brexit would have a positive impact on NAV per share as currently only 26% of the portfolio is denominated in sterling. Conversely a strengthening of sterling as a result of Brexit would reduce the sterling value of JLG’s investments denominated in overseas currencies.
Valuation
NAV per share remains the principal benchmark for evaluating JLG’s share price. In this section we analyse JLG’s share price in relation to its peers and its last declared NAV per share.
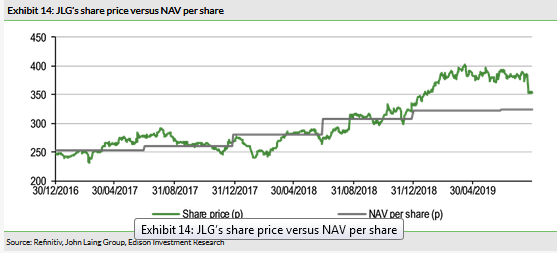
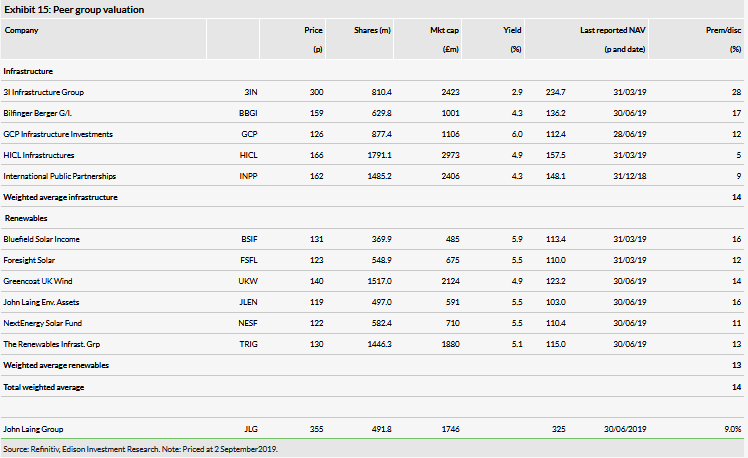
Exhibit 14 shows that JLG’s share price has performed strongly over the last few years and despite the fall that followed the H1 results, still stands at a c 9% premium to its last reported NAV of 325p/share. This compares to an average premium of c 4% over the period since the beginning of 2017.
As a result of the recent fall in the share price, JLG’ s premium to NAV per share of c 9% stands slightly below our calculation of the peer group average of c 14%. With the prospect of a stronger second half, a positive macro environment for infrastructure investment and a less challenging valuation, JLG’s shares appear attractive at current levels.
Financials
Below we set out the principal assumptions that underpin our forecasts. It is worth reiterating that JLG’s guidance remains for investment commitments of approximately £1.0bn over the three-year period (2019–2021), with realisations expected to be broadly in line with investment commitments. Overall, we are now forecasting a FY19 NAV per share of 353p (versus 360p previously).
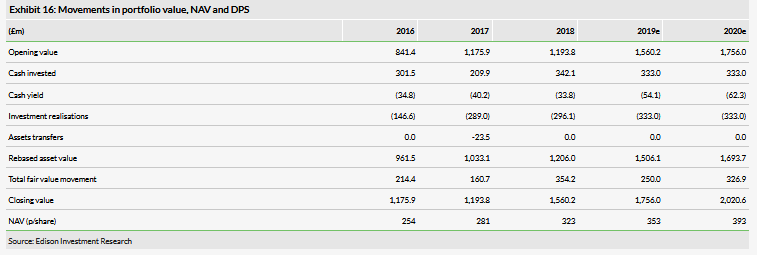
Investments: we assume new investments of £333m for FY19 and FY20 (average 2014–18 c £230m).
Realisations: we forecast investment realisations of £333m in FY19 and FY20 (average 2014–18 c £203m).
Cash yield and FV adjustments: we use an assumed yield of 6% (of average secondary portfolio value) to calculate the cash yield for FY19 of £54.1m and £62.3m in FY20 (FY18 £33.8m). We forecast total FV adjustments for FY19 of £250.0m and £326.9m in 2020 (FY18 354.2m, H119 £52m). The FV movements are calculated as a percentage of the rebased asset value (16.6% for FY18 and 19.3% for FY19 versus 2014–18 average of 22.3%).
Investment management income: with the loss of external investment management services revenue beyond FY19 we expect ‘other income’ (included in total revenue) to decline from c £30m in 2019 to £12m in 2020.
Administration costs: we assume administration costs of £64.9m in FY19 (FY18 £65.6m) and £66.2m in FY20.
Pension contributions: we forecast continuing contributions of £29.1m in FY19 and £24.9m in FY20.
Tax: we assume minimal/no tax provisions in FY19 and FY20 (FY18 £0.3m).
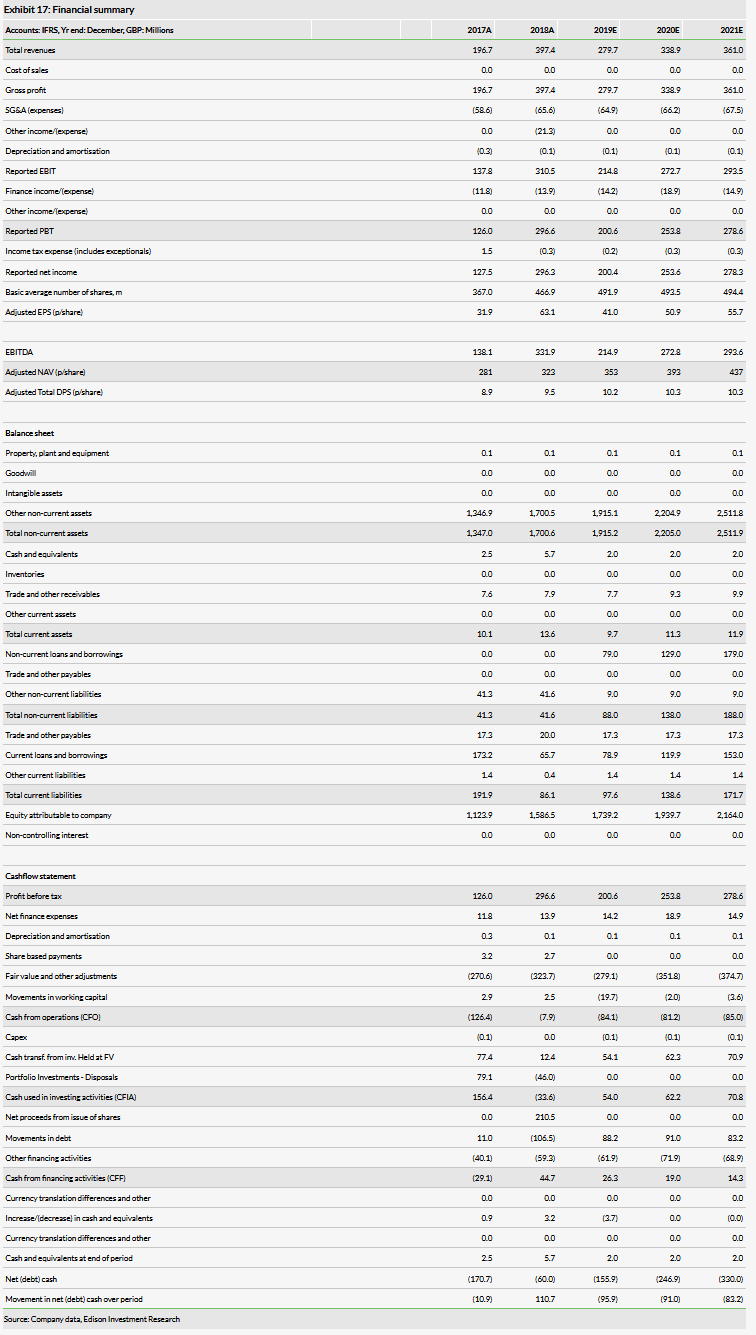
DPS: JLG’s policy is to increase the ordinary DPS ‘at least in line with inflation’. JLG also aims to pay a special dividend equivalent to 5–10% of the gross proceeds from the sale of investments. We forecast a DPS of 10.16p for FY19 and 10.31p for FY20. Our forecasts are based on a 3.1% annual increment in the ordinary DPS. For our special dividend forecast, we assume a pay-out equivalent to 6.8% of our assumptions for realisations (see above).