In the 1980s and early 1990s, Japan’s economy was nothing short of spectacular. Countries around the globe endeavored to emulate it. Total Quality Management. Just-In-Time. Reengineering. Those buzz words even found their way into the training practices for the U.S. Navy.
Since 1992, however, Japan’s economy has stagnated. The value of goods and services produced by the nation (a.k.a. GDP) has averaged less than 1% per year.
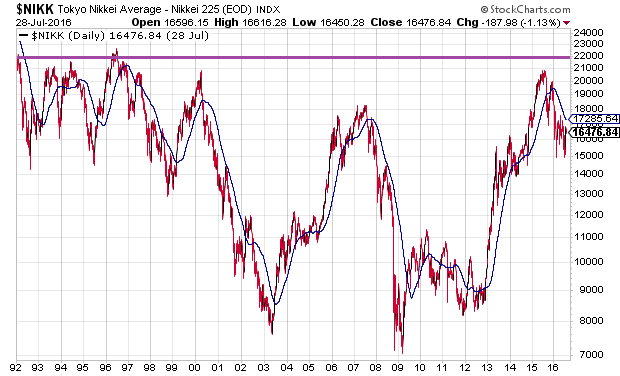
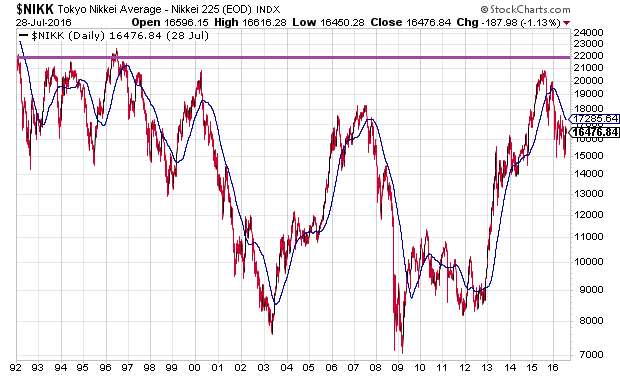
In the same period, Japan’s debt has skyrocketed. The country’s debt-to-GDP has increased from less than 100% to somewhere in the vicinity of 230%. And its stock market since 1992? A buy-n-holder’s worst nightmare.
Relatively speaking, the U.S. economy has been a bright spot. It has been growing at an approximate rate of 2% in the the 21st century. That’s quite a bit slower than the 3% GDP norm that economists had come to expect. Nevertheless, many have grown comfortable with the notion that expansion at 2% is far better than Japanese or European style lethargy.
Until now.
U.S GDP grew at an approximate clip of 1.2% in the second quarter. Meanwhile, growth in Q4 of last year was revised down to 0.9% and growth in Q1 of this year was revised down to 0.8%. In other words, economic growth stateside has expanded at less than 1% over the last 9 months.
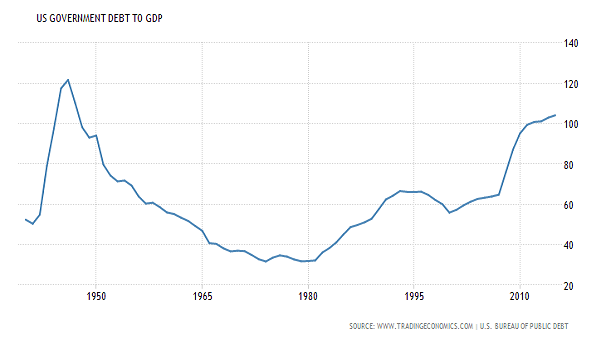
Unfortunately, it is not just the economy’s stall speed that reminds some folks of Japan’s malaise. Our debt levels are soaring through the roof as well. U.S. government debt-to-GDP has reached 104%. Even more alarming? government debt-to-revenue (federal tax) is at 979%. For the 34 countries in the Organization for Economic Cooperation and Development (OECD), that’s the 2nd worst debt reading in the world. (Japan is the worst offender at 2359%.)
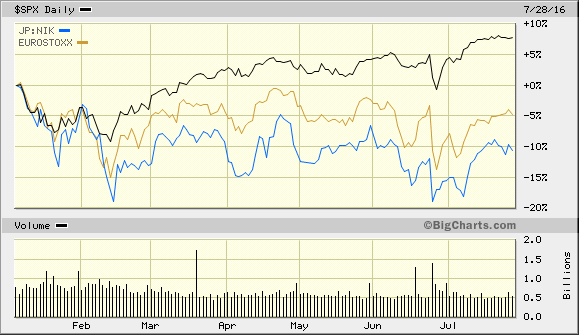
Super-slow growing economies? Unsustainable debt levels? Japanese stocks are down roughly 5% and European stocks are down roughly 10% due to these types of concerns. And yet, U.S. stocks have managed to climb 7.5% in spite of them.
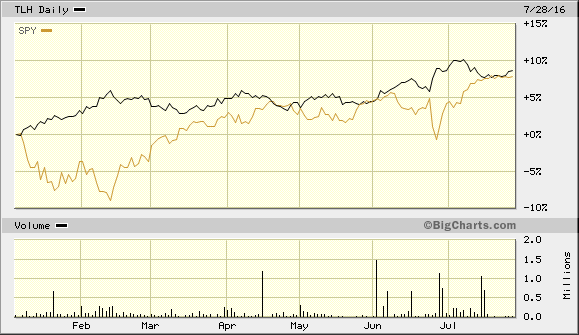
At the same time, U.S. treasury bonds have actually provided a better risk-adjusted return than stocks in 2016. With the 10-year yield shedding 75 basis points from roughly 2.3% to 1.55% and realized volatility of 5, the Sharpe ratio for treasury bonds comes in at 1.5. Stocks? 0.6. One can visualize the asset classes by looking at proxies such as iShares 10-20 Year Treasury Bond (TLH) and the S&P 500 SPDR Trust (SPY).
Now here is a sobering thought: What if the U.S. is in the process of turning Japanese? In particular, our longer-term economic growth began slowing considerably about eight years after Japan (2000 versus 1992). And the Federal Reserve began the process of buying market-based securities with electronic money (a.k.a. “quantitative easing” or “QE”) about eight years after the Bank of Japan (BOJ) to stimulate the U.S. economy.
Consider Japanese equities in its chart since 1992 once more. Obviously, it has been an exceptionally disappointing run since the “Land of the Rising Sun” combined sloth-like economic growth with ever-increasing debt obligations.
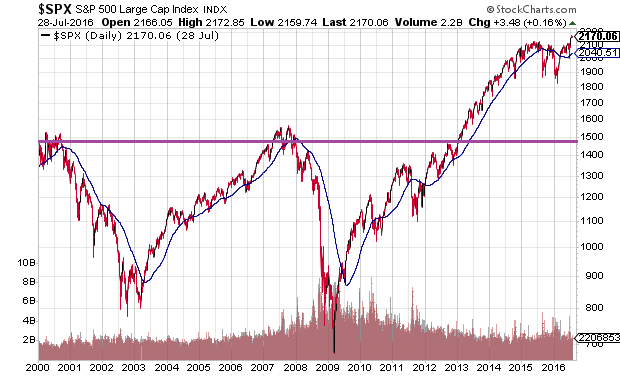
Less obvious? Since the U.S. began traveling a similar path as Japan in 2000, U.S. stocks have been able to amass unrealized nominal gains of around 47%. Perhaps ironically, an average bear market in history is roughly 33%. That’s about the same percentage that would take U.S. stocks back to 0% nominal gains for the 21st century.
No, the U.S. is not Japan. That said, we’re facing the same types of systemic challenges. Anemic economic growth. Unmanageable debt levels that require terminally low interest rates to even contemplate servicing the interest payments. Some investors even see the same types of deflationary pressures that have plagued the rest of the developed world.
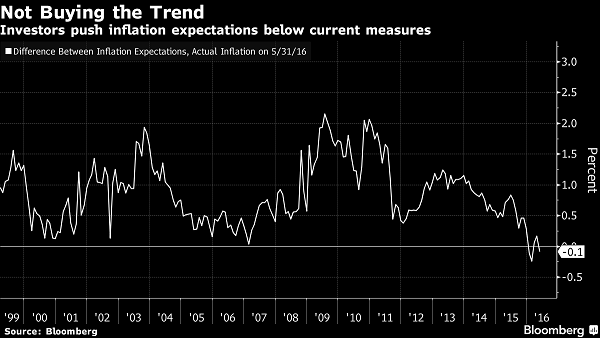
Again, let’s go back to 2000. Rarely does one find a moment where investor expectations for inflation came in lower than the inflation data itself. Yet that’s what is taking place.
According to analysts like Joachim Fels at Pacific Investment Management Co. (PIMCO), the trend demonstrates waning confidence in the Fed’s inflation-targeting through its monetary policies.
Lose faith in the ability of central banks to accomplish what they say they can accomplish? If that loss of faith infiltrates the belief that the Fed can levitate stock prices with endless rate manipulation, excessive exposure to risk assets would prove painful for the aggressively allocated crowd. You ought to have some cash on hand to buffer portfolio volatility as well as prepare to acquire riskier assets at more attractive price levels.

