
Today the Institute for Supply Management published its latest Non-Manufacturing Report. The headline NMI Composite Index is at 58.6 percent, signaling faster growth than last month's 56.0 percent. The August is the highest reading since the January 2008 inception of the composite. Today's number beat the Investing.com forecast of 55.0 percent and Briefing.com's 54.5 percent consensus.
Here is the report summary:
The NMI™ registered 58.6 percent in August, 2.6 percentage points higher than the 56 percent registered in July. This indicates continued growth at a faster rate in the non-manufacturing sector. This month's NMI™ is the highest reading for the index since its inception in January 2008. The Non-Manufacturing Business Activity Index increased to 62.2 percent, which is 1.8 percentage points higher than the 60.4 percent reported in July, reflecting growth for the 49th consecutive month. The New Orders Index increased by 2.8 percentage points to 60.5 percent, and the Employment Index increased 3.8 percentage points to 57 percent, indicating growth in employment for the 13th consecutive month. The Prices Index decreased 6.7 percentage points to 53.4 percent, indicating prices increased at a significantly slower rate in August when compared to July. According to the NMI™, 16 non-manufacturing industries reported growth in August. The majority of respondents' comments continue to be mostly positive about business conditions and the direction of the overall economy.
Like its much older kin, the ISM Manufacturing Series, I have been reluctant to focus on this collection of diffusion indexes. For one thing, there is relatively little history for ISM's Non-Manufacturing data, especially for the headline Composite Index, which dates from 2008. The chart below shows Non-Manufacturing Composite. We have only a single recession to gauge is behavior as a business cycle indicator.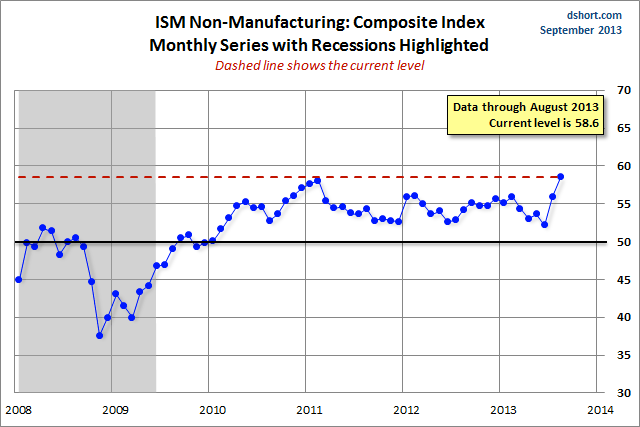
In my view, the more interesting and useful subcomponent is the Non-Manufacturing Business Activity Index.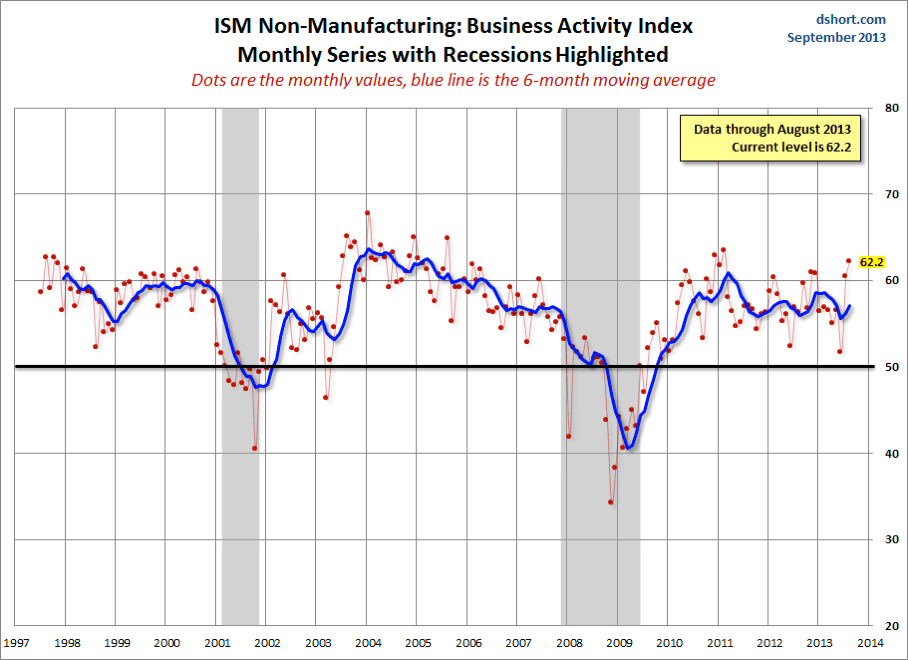
For a diffusion index, the latest reading indicates growth at a faster rate than last month and the fastest of the past five months. But this can be an extremely volatile indicator. Thus I've added a six-month moving average to assist us in visualizing trends.
Theoretically, I believe, this indicator will become more useful as the timeframe of its coverage expands. Manufacturing may be a more sensitive barometer than Non-Manufacturing activity, but we are increasingly a services-oriented economy, which explains my intention to keep this series on the radar.
Here is a link to my coverage of ISM Manufacturing report released earlier this week.
Note: I use the FRED USRECP series (Peak through the Period preceding the Trough) to highlight the recessions in the charts above. For example, the NBER dates the last cycle peak as December 2007, the trough as June 2009 and the duration as 18 months. The USRECP series thus flags December 2007 as the start of the recession and May 2009 as the last month of the recession, giving us the 18-month duration. The dot for the last recession in the charts above are thus for November 2007. the "Peak through the Period preceding the Trough" series is the one FRED uses in its monthly charts, as illustrated here.
- English (UK)
- English (India)
- English (Canada)
- English (Australia)
- English (South Africa)
- English (Philippines)
- English (Nigeria)
- Deutsch
- Español (España)
- Español (México)
- Français
- Italiano
- Nederlands
- Português (Portugal)
- Polski
- Português (Brasil)
- Русский
- Türkçe
- العربية
- Ελληνικά
- Svenska
- Suomi
- עברית
- 日本語
- 한국어
- 简体中文
- 繁體中文
- Bahasa Indonesia
- Bahasa Melayu
- ไทย
- Tiếng Việt
- हिंदी
ISM Non-Manufacturing Index: Faster Growth Than Forecast
Published 09/05/2013, 11:57 AM
Updated 07/09/2023, 06:31 AM
ISM Non-Manufacturing Index: Faster Growth Than Forecast
3rd party Ad. Not an offer or recommendation by Investing.com. See disclosure here or
remove ads
.
Latest comments
Install Our App
Risk Disclosure: Trading in financial instruments and/or cryptocurrencies involves high risks including the risk of losing some, or all, of your investment amount, and may not be suitable for all investors. Prices of cryptocurrencies are extremely volatile and may be affected by external factors such as financial, regulatory or political events. Trading on margin increases the financial risks.
Before deciding to trade in financial instrument or cryptocurrencies you should be fully informed of the risks and costs associated with trading the financial markets, carefully consider your investment objectives, level of experience, and risk appetite, and seek professional advice where needed.
Fusion Media would like to remind you that the data contained in this website is not necessarily real-time nor accurate. The data and prices on the website are not necessarily provided by any market or exchange, but may be provided by market makers, and so prices may not be accurate and may differ from the actual price at any given market, meaning prices are indicative and not appropriate for trading purposes. Fusion Media and any provider of the data contained in this website will not accept liability for any loss or damage as a result of your trading, or your reliance on the information contained within this website.
It is prohibited to use, store, reproduce, display, modify, transmit or distribute the data contained in this website without the explicit prior written permission of Fusion Media and/or the data provider. All intellectual property rights are reserved by the providers and/or the exchange providing the data contained in this website.
Fusion Media may be compensated by the advertisers that appear on the website, based on your interaction with the advertisements or advertisers.
© 2007-2024 - Fusion Media Limited. All Rights Reserved.