As the equity markets rallied on Thursday and Friday, I saw a number of analysts and commentators starting to jump on the bulls' bandwagon as they asked the question, "Is the correction over?"
To truly answer that question, we have to first answer the question of why stock prices went down in the first place. There are two popular reasons advanced for the decline in 2014:
- Emerging market meltdown fears, possibly driven by the effects of a Fed taper; or
- A US growth slowdown.
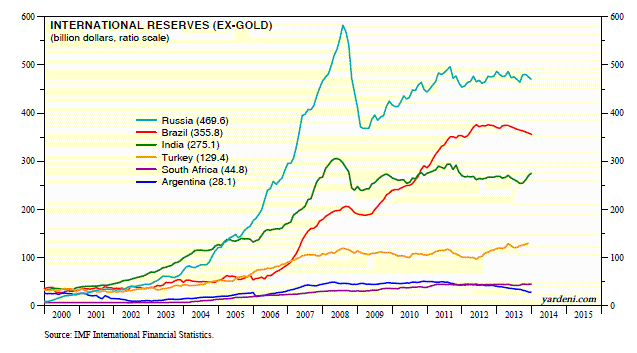
In the past few weeks, selected EM currencies came under attack by speculators. As the decline in the Turkish Lira and other currencies went on, fears of an EM crisis similar to the Asian Crisis began to emerge. While there has been some stress in EM currencies and economies, Ed Yardeni correctly pointed out that the foreign exchange reserve position of many EM countries are much improved compared to past crisis periods:
Helping some of the emerging markets weather their storms should be the record amount of non-gold international reserves that they hold. IMF data show that collectively they held a record $7.8 trillion during November. China’s reserves account for about half of that sum. However, some of the more troubled emerging economies also held sizeable record or near-record reserves at the end of last year: Russia ($470bn), Brazil ($356bn), India ($275bn), Turkey ($129bn), South Africa ($45bn), and Argentina ($28bn).
OUTSIDE SCREAMING "Murder! There's been a murder! Mr Holmes! Come quick!"
[Holmes stirs from the obituaries column in The Times, walks over to the fire where, after warming himself, secures the guard and places his Meerschaum pipe on its rest on the mantlepiece]
HOLMES "Watson, bring me my coat, it appears that there is a disturbance".
[Outside in the street, A crowd throngs around Holmes]
HOLMES "Please, can you all calm down. what is the trouble?"
CROWD "There s been a MURDER well more than one murder, its terrible! It's down the Eeyems. Mrs Turkey. She's DEAD! And Mr Rand, And the Hungarian lass and the Russki kid.
HOLMES "Come Watson, best we pay a visit, if for no reason other than to calm this over-excitable lot."
[Arriving on scene - The Eeyems is a higgledy hotchpotch of narrow streets once populated by the poor but the arrival of an aspirational young has seen pretences of gentrification, however the underlying squalor is never far away. Holmes and Watson are let in to a dingy hovel by an attendent constable where an old woman is propped gasping against a table.]
HOLMES "Ah Mrs Turkey, I see that you are breathing. A good sign of a lack of death. Watson, would you be so kind?
Dr WATSON "Her PMI is slightly weaker than the last reading but apart from a bit of bruising to the FX causing some rate shock she's not in too bad a way".
HOLMES "Hmm .. so not DEAD then Watson".
Dr WATSON "No sir. Not Dead."
HOLMES "Not a murder then. No."
BYSTANDER "But, but she WILL die though and THEN it will be a murder"
HOLMES "It will only be murder when I say it is a murder. What makes you so sure that she will be murdered"
BYSTANDER "Well look at her, she's weak and feeble, hasn't been able to defend herself against the last attackers so she's just bound to be murdered"
...and so on. Was Mr. Market so excitable to freak out on the mere possibility of an EM currency crisis? These conditions were present during the equity market run-up and bulls have shrugged off these kinds of concerns before.
US growth slowdown?
What about fears of a US growth slowdown? The chart below of the Citigroup US Surprise Index (in orange) measures whether the latest macro-economic releases have beaten or missed Street expectations. A positive reading indicates that there were more beats than misses and a negative reading the opposite. While the pace of "beats" have been coming down, they remain positive. So relax.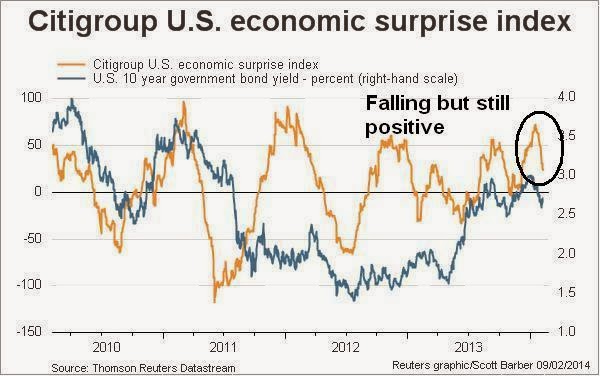
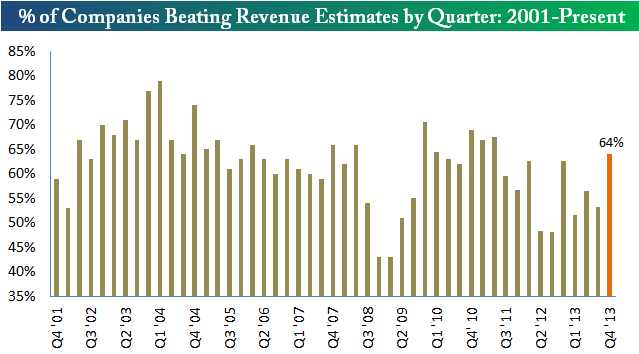
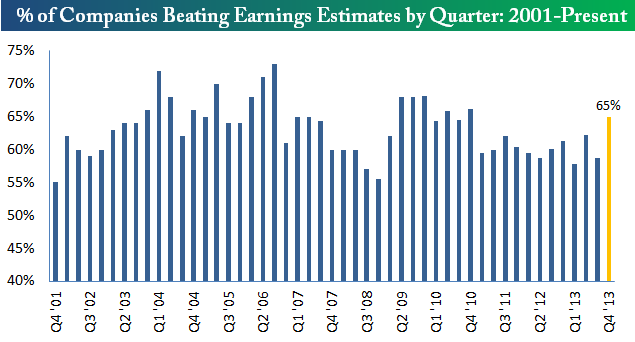
If the economy is slowing down, what about corporate earnings? As Bespoke pointed out, with about 2/3 of companies having reported Q4 earnings, the earnings beat rates are above the historical average.
The revenue beat rates are coming in pretty well too:
A technical driven pullback
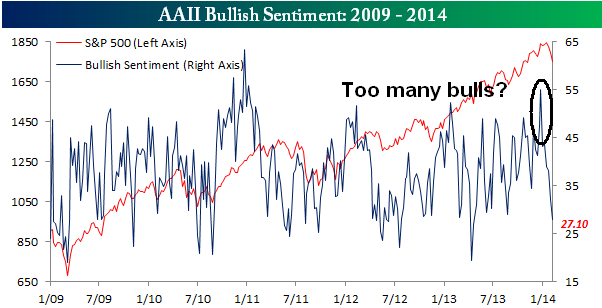
The simplest explanation of the recent pullback is because of excessively bullish sentiment and an overbought condition in the market. The fast money got into a crowded long position and, when there were no buyers left and the momentum started to roll over, the crowd seized on the excuse of the day (EM crisis, Fed taper, US economic weakness, etc.) to sell.
The excessively bullish sentiment has been well documented by many commentators, such as The Short Side of Long, and well summarized by Bespoke in this analysis of the AAII sentiment survey which moved into an extremely crowded long reading in late December and early January and then pulled back:
Has the stock market bottomed?
With bullish sentiment in full retreat, is this a time for traders to plunge back into the long side of the stock market?
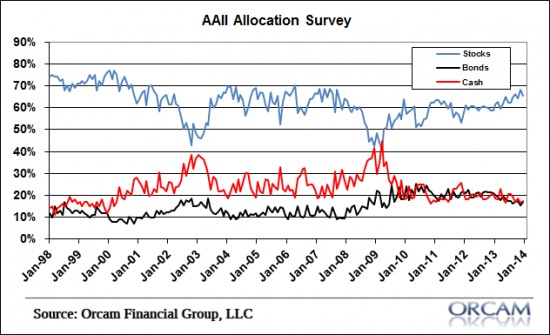
Not so fast. An examination of longer term indicators suggest that a durable bottom may not be at hand yet. While the AAII sentiment surveys are measures of opinion and intention, the AAII Allocation Survey is a measure of investors actually did - this is a case of watching what they do, not just what they say. The latest AAII Allocation Survey (via Pragmatic Capitalism) shows that while equity allocations have ticked down, they are nowhere near panic levels.
An analysis of short and longer term market breadth indicators tell a more nuanced story than the more simple oversold bounce narrative. While short-term indicators suggest that a bounce is at hand, longer term indicators are not necessarily showing the signs of full capitulation and more volatility is ahead.
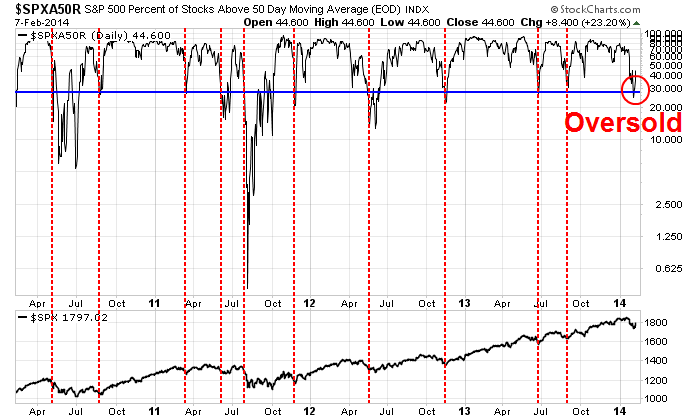
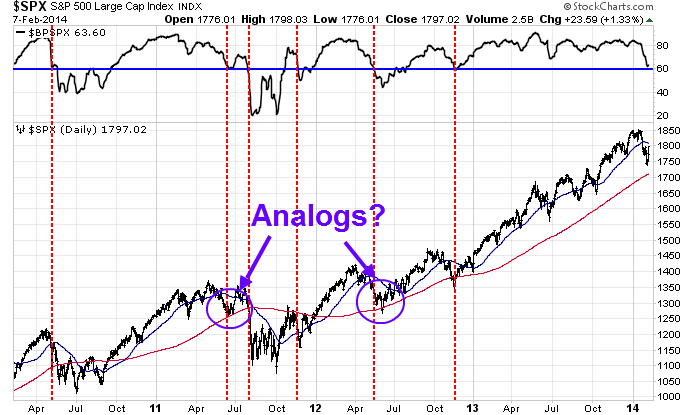
Consider, for example, this chart of the percentage of stocks below their 50 day moving average (shown in the top panel) as an example of a short-term breadth indicator (SP 500 shown in the bottom panel). I drew a blue horizontal line to indicate the level this indicator recently reached last week, and dotted red vertical lines to show past instances when a similar level was breached in the last four years. More often than not, the levels reached last week are consistent with a short-term bottom and bounce in stock prices.
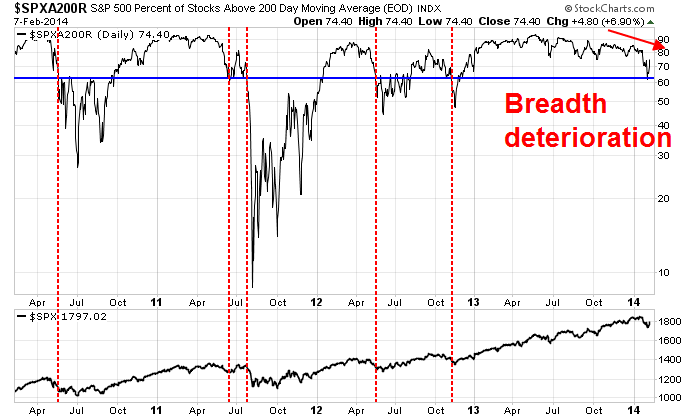
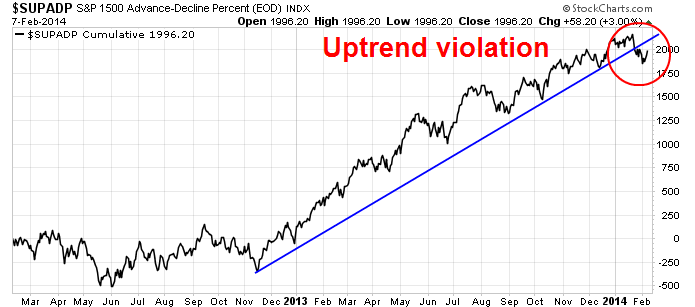
My conclusion is that too much technical damage has been sustained by the market for equities to simply rebound and rally to new highs immediately. The chart of the SP 1500 advance-decline line below has breached an uptrend line that stretched all the way back to late 2012. Such violations tend not to be resolved by a bounce back from an oversold condition and, at a minimum, a period of sideways consolidation is needed before stock prices can go higher.
More volatility ahead
My base case scenario calls for a short-term rally and several weeks of volatility, with the SPX bounded by the 200 day moving average below and the 50 day moving average above. The chart below of another longer term breadth indicator, percentage of stocks with bullish point and figure readings, tell the story. Given the recency of the breach of the 50 dma, the most likely analogs of current market conditions occurred in the summers of 2011 and 2012 (circled), where stock prices bounced around in a volatile fashion until breadth measures began to improve again and stock prices began to rally again.
These conditions are consistent with the scenario that I sketched out in December (see My plan for 2014) where stock prices peak about mid-year, at which point it would likely present a great buying opportunity:
My base case scenario calls for stock prices to continue to grind upwards until mid-2014, at which point some unknown catalyst is likely send equities downwards. Some time during Q2 and Q3, I would have to re-evaluate the macro conditions and re-position portfolios accordingly.For now, my inner trader is getting ready for volatility and contemplating going short this market as the SPX approaches the 50 dma. My inner investor is yawning and ignoring all of these short-term fluctuations. If he had some new cash, he would regard the current weakness as a buying opportunity.
Disclosure: Cam Hui is a portfolio manager at Qwest Investment Fund Management Ltd. (“Qwest”). The opinions and any recommendations expressed in the blog are those of the author and do not reflect the opinions and recommendations of Qwest. Qwest reviews Mr. Hui’s blog to ensure it is connected with Mr. Hui’s obligation to deal fairly, honestly and in good faith with the blog’s readers.”
None of the information or opinions expressed in this blog constitutes a solicitation for the purchase or sale of any security or other instrument. Nothing in this blog constitutes investment advice and any recommendations that may be contained herein have not been based upon a consideration of the investment objectives, financial situation or particular needs of any specific recipient. Any purchase or sale activity in any securities or other instrument should be based upon your own analysis and conclusions. Past performance is not indicative of future results. Either Qwest or I may hold or control long or short positions in the securities or instruments mentioned.

