It has been the usual practice for quarterly earnings estimates to come down ahead of the start of each earnings season. This trend has been particularly notable over the last couple of years as management teams have been consistently providing weak guidance, causing estimates to come down.
One could cite a variety of reasons for why this has been the norm lately, but the most logical though cynical explanation is that management teams have a big incentive to manage expectations. After all, it pays to under-promise and over-deliver (Note: Please take a look at the chart towards the end of this write-up that graphically shows this expectations management practice).
Given this context, there is no surprise that estimates for the 2015 Q1 earnings estimates followed a similar negative revisions trend. That said, the magnitude of negative revisions for 2015 Q1 exceeds any other recent quarter by a big margin.
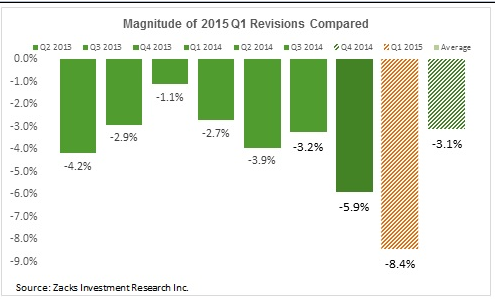
The chart below shows the magnitude of negative revisions for each quarter since 2013 Q2 over the first 11 weeks of the period. As you can see, 2015 Q1 estimates have fallen -8.4% since January 1st, the most of any other recent quarter in the comparable period. Please note that the ‘average’ represents the average for the 7-quarter period through 2014 Q4.
Chart 1: The Magnitude of 2015 Q1 Earnings Revisions Compared
The Energy sector’s travails resulting from the sharp drop in oil prices are well known; we saw that in the sector’s performance in the last earnings season as well, when total earnings for the Energy sector were down -17.3% on -13.5% lower revenues. The Energy sector was a drag on the aggregate growth picture in 2014 Q4 and perhaps something similar was at play in the unusually high level of negative revisions in 2015 Q1 as well.
This is a valid point and the negative earnings revisions for the Energy sector do provide a big part of the explanation for why Q1 estimates have fallen so much. After all, total earnings estimates for the sector have dropped -47.3% since the start of the quarter in early January. The current Zacks Consensus EPS estimates for Exxon (NYSE:XOM) and Chevron (NYSE:CVX) of $0.79 and $0.74 are down -34.2% and -51.6% over the last 90 days, respectively.
But it would be wrong to blame the Energy sector alone for the outsized negative revision to Q1 estimates that chart 1 above shows. The magnitude of negative revisions to Q1 estimates is still the highest of any other recent quarter after we isolate and exclude the Energy sector from the aggregate picture. We show that in chart 2 below which compares the magnitude of Q1 estimates on an ex-Energy basis.
Chart 2: Magnitude of Q1 Revisions outside of the Energy Sector
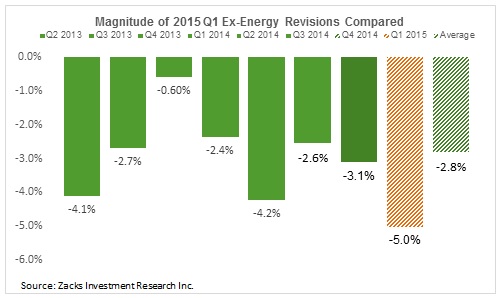
Chart 3 below looks at the same revisions trend from another angle. Instead of the magnitude of revisions in total earnings over the quarter to date period, here we are showing how the estimates of total earnings growth have evolved over this time period. We show the evolving aggregate growth picture for the S&P 500 index as a whole (green bars), as well as on an ex-Energy sector basis (grey bars).
Chart 3: Evolution of 2015 Q1 Growth Estimates
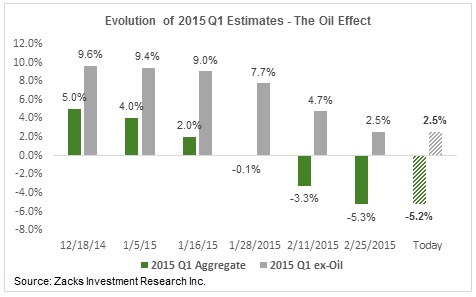
Chart 4 below shows the major sectors that have suffered the biggest negative revisions since the start of the quarter. Please note that each of the 16 Zacks sectors has suffered negative revisions; the Utilities sector has the lowest negative revision, but has nevertheless gone down.
Chart 4: Major Sectors with Big Negative Revisions
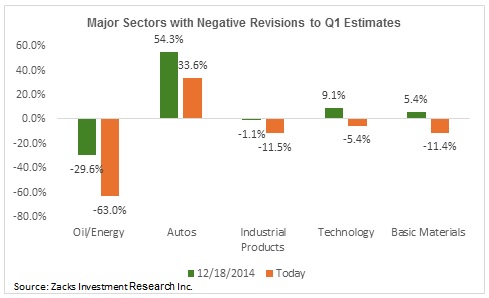
As you can see in chart 4, even the Technology sector has suffered negative revisions, with earnings for the sector now expected to be down -5.4% from the same period last year vs. expectations of +9.1% growth at the start of the quarter. Estimates for all the key sector players like Google (NASDAQ:GOOGL), Microsoft (NASDAQ:MSFT), Intel (NASDAQ:INTC) and IBM (NYSE:IBM) have come down since January.
Are Q1 Estimates Too Low?
The pronounced downshift in Q1 estimates has prompted some on Wall Street to start claiming that the revisions trend may have a gone bit too much; meaning that estimates have likely become too low. It is hard to find a basis for such a claim in real time, particularly given the global growth woes and still-high U.S dollar.
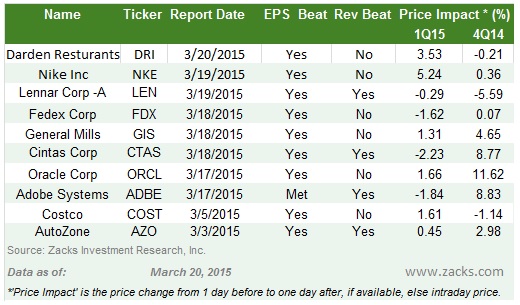
The market’s reaction to the results from the 10 S&P 500 members that have already reported Q1 results (all of these companies have reported fiscal February quarter results that get counted as part of the Q1 tally) doesn’t support the claim that estimates may be too low. The last two columns in the summary table below shows the price impact of each company’s earnings result for this quarter as well as the preceding one.
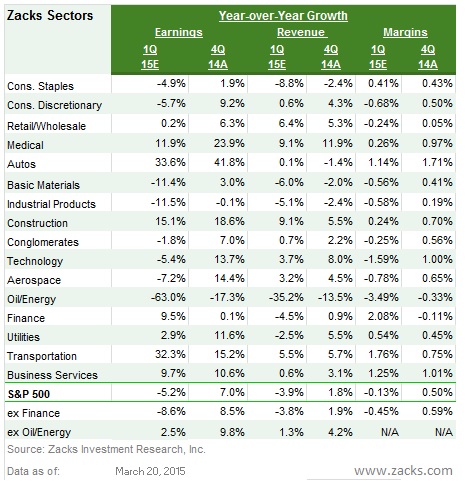
The table below presents the summary picture for Q1 contrasted with what companies actually reported in the 2014 Q4 earnings season.
This Week’s Reporting Calendar
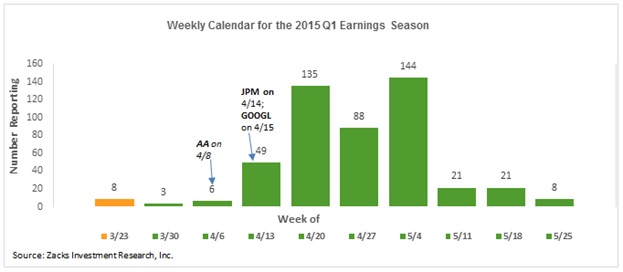
As mentioned earlier, companies with fiscal quarters ending in February have been reporting quarterly results already and all of those get counted as part of our 2015 Q1 tally. As of Friday, March 20th, we have seen such results from 10 S&P 500 members already. This week, we will get results from 66 companies in total, including 8 S&P 500 members.
The chart below shows when 2015 Q1 earnings reports will come out on a weekly basis.
Here is a list of the 66 companies reporting this week, including 8 S&P 500 members.
| Company | Ticker | Current Qtr | Year-Ago Qtr | Last EPS Surprise % | Report Day | Time |
| FMSA HOLDINGS | FMSA | 0.28 | N/A | 34.62 | Monday | BTO |
| VERITIV CORP | VRTV | 0.36 | N/A | -0.75 | Monday | BTO |
| AVINO SILVER&GD | ASM | N/A | -0.05 | -75 | Monday | BTO |
| BIOLINE RX LTD | BLRX | -0.13 | -0.2 | 81.82 | Monday | BTO |
| GEOPARK LTD | GPRK | 0.11 | 0.13 | -48.15 | Monday | BTO |
| SINOVAC BIOTECH | SVA | 0.03 | 0.09 | 100 | Monday | BTO |
| IDREAMSKY ADR | DSKY | 0.18 | N/A | -540 | Monday | BTO |
| VERICEL CORP | VCEL | -0.18 | -0.97 | -4 | Monday | AMC |
| FLEXION THERAPT | FLXN | -0.46 | N/A | 16.67 | Monday | AMC |
| CONCORD MED-ADR | CCM | 0.16 | 0.05 | 71.43 | Monday | AMC |
| MCCORMICK & CO | MKC | 0.64 | 0.62 | 1.75 | Tuesday | BTO |
| G-III APPAREL | GIII | 0.83 | 0.62 | 6.92 | Tuesday | BTO |
| HD SUPPLY HLDGS | HDS | 0.1 | 0 | 3.77 | Tuesday | BTO |
| IHS INC-A | IHS | 0.95 | 0.86 | 29.29 | Tuesday | BTO |
| EPIRUS BIOPHARM | EPRS | -1.01 | -3.6 | -197.67 | Tuesday | BTO |
| GENVEC INC | GNVC | 0.09 | -0.07 | -11.11 | Tuesday | BTO |
| HIGHPOWER INTL | HPJ | 0.12 | 0.09 | N/A | Tuesday | BTO |
| SONIC CORP | SONC | 0.12 | 0.07 | 12.5 | Tuesday | AMC |
| HEALTHEQUITY | HQY | 0.02 | N/A | 25 | Tuesday | AMC |
| STEELCASE INC | SCS | 0.21 | 0.18 | 11.54 | Tuesday | AMC |
| AMPHASTAR PHARM | AMPH | -0.06 | 0.05 | 0 | Tuesday | AMC |
| CHRISTOPHER&BNK | CBK | -0.1 | -0.01 | 33.33 | Tuesday | AMC |
| EXFO INC | EXFO | 0.01 | 0 | 100 | Tuesday | AMC |
| TURQUOISE HILL | TRQ | 0.06 | 0.1 | 100 | Tuesday | AMC |
| WOLSELEY -ADR | WOSYY | N/A | N/A | N/A | Tuesday | N/A |
| PAYCHEX INC | PAYX | 0.46 | 0.44 | 2.17 | Wednesday | BTO |
| APOLLO GROUP | APOL | -0.14 | 0.28 | 7.32 | Wednesday | BTO |
| LEIDOS HOLDINGS | LDOS | 0.48 | 0.56 | 25 | Wednesday | BTO |
| YINGLI GREEN EN | YGE | -0.14 | -0.31 | 15.38 | Wednesday | BTO |
| DESTINATION XL | DXLG | 0.03 | 0 | 20 | Wednesday | BTO |
| VERMILLION INC | VRML | -0.08 | -0.07 | N/A | Wednesday | BTO |
| FRANCESCAS HLDG | FRAN | 0.2 | 0.27 | 0 | Wednesday | BTO |
| RED HAT INC | RHT | 0.28 | 0.28 | 11.11 | Wednesday | AMC |
| PVH CORP | PVH | 1.72 | 1.43 | 3.23 | Wednesday | AMC |
| FIVE BELOW INC | FIVE | 0.6 | 0.47 | 0 | Wednesday | AMC |
| PAC SUNWEAR CAL | PSUN | -0.11 | -0.17 | 40 | Wednesday | AMC |
| FRANCO NV CP | FNV | 0.2 | 0.21 | 4.55 | Wednesday | AMC |
| TASEKO MINES LT | TGB | -0.03 | -0.03 | -700 | Wednesday | AMC |
| INOVALON HLDGS | INOV | 0.11 | N/A | N/A | Wednesday | AMC |
| USD PARTNERS | USDP | 0.26 | N/A | N/A | Wednesday | AMC |
| ALEXCO RESOURCE | AXU | -0.02 | -0.01 | 50 | Wednesday | AMC |
| MONOGRAM REIT | MORE | 0.1 | N/A | N/A | Wednesday | AMC |
| SILVERCREST MIN | SVLC | N/A | 0.01 | -25 | Wednesday | AMC |
| WORTHINGTON IND | WOR | 0.39 | 0.58 | -19.12 | Wednesday | AMC |
| ACCENTURE PLC | ACN | 1.07 | 1.03 | 8.4 | Thursday | BTO |
| CONAGRA FOODS | CAG | 0.53 | 0.62 | 0 | Thursday | BTO |
| FREDS INC | FRED | 0.01 | 0.17 | -14.29 | Thursday | BTO |
| LAKE SHORE GOLD | LSG | 0 | 0 | -33.33 | Thursday | BTO |
| LULULEMON ATHLT | LULU | 0.73 | 0.75 | 10.53 | Thursday | BTO |
| SIGNET JEWELERS | SIG | 3.03 | 2.18 | 23.53 | Thursday | BTO |
| COMMERCIAL METL | CMC | 0.19 | 0.12 | 28 | Thursday | BTO |
| NEOGEN CORP | NEOG | 0.23 | 0.18 | -4.55 | Thursday | BTO |
| CHINA AUTO SYS | CAAS | 0.27 | 0.26 | 14.29 | Thursday | BTO |
| WINNEBAGO | WGO | 0.38 | 0.35 | -17.78 | Thursday | BTO |
| GAMESTOP CORP | GME | 2.16 | 1.9 | -8.06 | Thursday | AMC |
| NV5 HOLDING INC | NVEE | 0.21 | 0.07 | 14.81 | Thursday | AMC |
| OXFORD INDS INC | OXM | 1.04 | 0.89 | -75 | Thursday | AMC |
| ROKA BIOSC INC | ROKA | -0.54 | N/A | -30.61 | Thursday | AMC |
| UPLAND SOFTWARE | UPLD | -0.24 | N/A | -77.78 | Thursday | AMC |
| GEVO INC | GEVO | -0.11 | -0.35 | 27.78 | Thursday | AMC |
| VOXELJET AG-ADR | VJET | -0.06 | -0.23 | -100 | Thursday | AMC |
| BLACKBERRY LTD | BBRY | -0.02 | -0.08 | 116.67 | Friday | BTO |
| FINISH LINE-CLA | FINL | 0.84 | 0.87 | -300 | Friday | BTO |
| SPARK ENERGY | SPKE | 0.85 | N/A | -75 | Friday | BTO |
| ERSTE GROUP BNK | EBKDY | N/A | -0.62 | N/A | Friday | AMC |
| CEMIG SA -ADR | CIG | N/A | N/A | N/A | Friday | N/A |
