During the past week, there has been a few more posts on income inequality. The most notable to me:
- John Mauldin's "When Inequality Isn't" where it is argued that increasing income inequality is a myth.
- Mish's "No Increase in Wealth Inequality for Top 1% Since 1960" where it is argued that it is only the 0.1% (and not the top 1%) which is causing the income inequality.
Follow up:
Please consider that US Census defines incomes as income received on a regular basis (exclusive of certain money receipts such as capital gains) before payments for personal income taxes, social security, union dues, medicare deductions, medical insurance, etc. Therefore, money income does not reflect the fact that some families receive part of their income in the form of non-cash benefits, such as food stamps, health benefits, subsidized housing, and goods produced and consumed on the farm. Consider that both the lowest quintile and the highest quintile has significant "income" which is not counted. Most of the middle quintiles are viewed without determining "real spendable income". The Mish study referenced above uses US Census income.
This past week, we posted that household median incomes had a nice increase in February. This data set uses US Census incomes.
On the other hand, the John Mauldin post went the other direction and used expenditures instead of income to argue that inequality is not growing. John Lounsbury muses:
The Myth of Increasing Income Inequality (John Mauldin, Thoughts from the Frontline - free subscription required) This is a review and discussion of a paper published by the Manhattan Institute: The Myth of Increasing Income Inequality (Diana Furchtgott-Roth). The key element of the paper is the relative constancy of consumer expenditures relative to income level over a recent 25-year period.

Diana Furchtgott-Roth (F-R) argues that personal expenditures are a better measure of income disparity than trying to measure income directly. F-R correctly points out that there are distortions in the income numbers over the time span because of changes in the tax law that have encouraged movement of income from corporate returns to individual income returns and that has occurred predominately at higher income levels.
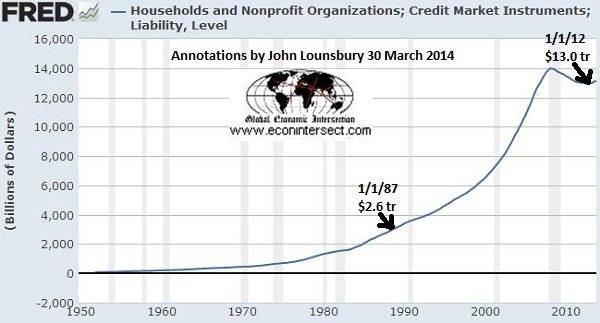
But there are distortions in the personal consumption expenditure numbers as well and F-R has not included them. One huge distortion that should be apparent comes from the level of personal debt which has exploded more than 4-fold over the 25 years studied. Adjusted for inflation (CPI) the increase is more than 1.6X.
The debt above includes mortgage debt, which was about $7.9 trillion for households at the beginning of 2012. See graph below from the New York Fed. Econintersect does not have an estimate for what portion of mortgage debt ended up adding to personal consumption expenditure (PCE), but some part certainly did. In what follows we will not consider any mortgage debt interaction with personal consumption.
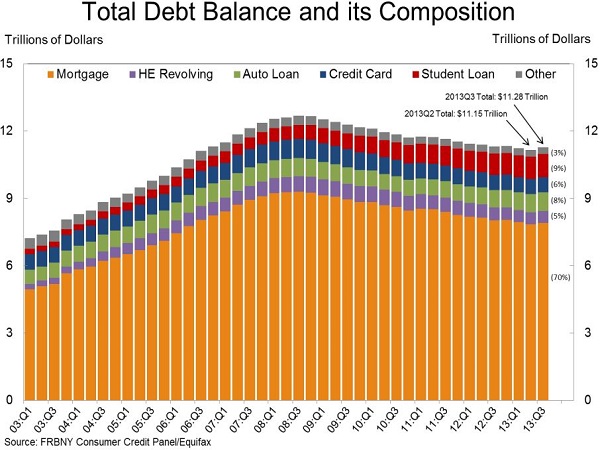
The per captita household debt 01 January 2012 was more than $43,000, up from an inflation adjusted $26,500 in 1987. If we averaged the increase uniformly over the 25 years (obviously not a good estimate because the last 5 years have seen a decline) the increase in debt each year would have been near 4%, adjusted for inflation. But that includes mortgage debt and we must exclude some unknown portion of mortgage debt from our consideration of PCE. To repeat, in what we do here we are excluding all of it.
From the Fred data base we obtain a value for real disposable personal income at the beginning of 1987 of $5.7 trillion (2009 chained dollars), or adjusted to 2012 dollars, $6.3 trillion. From a 1987 New York Fed report (page 37) the ratio of consumer debt to disposable income was almost exactly 0.20 from 1966 through 1985; we will use that ratio for 1987.
This produces a 1987 consumer debt (mortgages excluded) of $1.3 trillion in 2012 dollars.
We have made the preceding calculations because we want to compare to the same analysis for personal expenditures. The data from the table above produces an average increase per year (calculated) of 0.4% (top quintile) and 0.5% (bottom). These amount to increases that would average in the range of $60-$70 a year for the bottom quintile and around $120-$130 for the top.
Now personal debt (sans mortgages) has grown from about $1.3 trillion to $3.4 trillion over the 25 years, which is from approximately $5,500 per capita in 1985 to about $11,000 in 2012, adjusted for inflation. That amounts to an average increase per year near 3% or about $240 ($160 in the first year increasing to $330 in the last*).
So the F-R paper has done a determination of income inequality by ignoring the elephant in the room: growth of debt. Household credit (without mortgages) increased between $200 and $500 most years from 1985 through 2012, an average around $240 a year.*
Increase in debt had a much greater impact on consumption than increase in income. The ratio is somewhere between 2x and 6x depending on how debt was acquired over the income quintiles and what year is examined.
* Of course there were five years where households were deleveraging (2008-2012) so the analysis will be considerably more complicated than just looking at 25-year averages.
Econintersect has not discovered a source of allocation of personal debt across the five income quintiles. Obviously that is needed to segregate effects of debt from income on consumption.
Many want to consider family size in determining income. Others geographic locations. Still others want to concentrate not on the household unit itself - but on wage earners (there can be zero to ?? wage earners in each family). There are advantages and disadvantages to each method.
You might ask do I have an agenda in this post. Admittedly I do. Just getting your hands around the data is a problem. Economists can calculate and calculate, but the data sets are defective in that they do not consider enough elements to draw an accurate conclusion. For this reason, I do not trust the GINI index as accurately portraying income inequality.
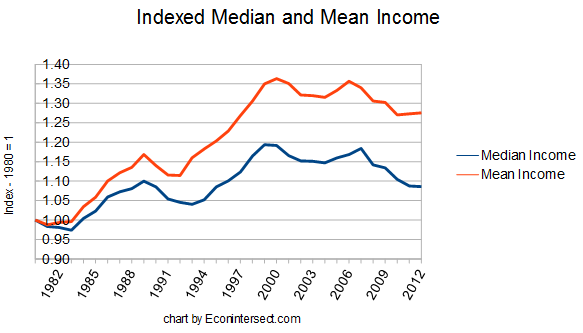
I believe there is a growing income inequality - and this is OPINION and not fact based on the flawed data available. One piece of circumstantial data is the growing delta between mean and median income which implies the lower end is weakening, or the upper end is strengthening - or both.
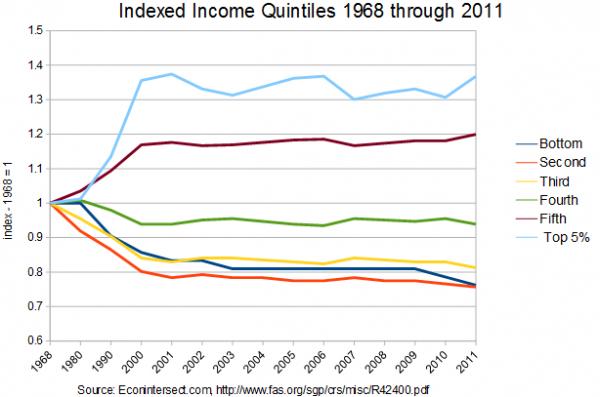
And another piece of data shows the lower income quintiles weakening.
I will continue to complain that you cannot come to any ACCURATE conclusions if you do not have complete and accurate data. The right leaning think tanks spin the data to show the problem is small or non-existent - while the left leaning think tanks exaggerate the data. There seems to be little disagreement that income inequality is not a positive element in an economy.
I just want to understand if the income inequality is growing.
Other Economic News this Week:
The Econintersect Economic Index for April 2014 is again showing an extremely slight growth deceleration - but a growing economy nonetheless. There are a growing number of soft data points we watch outside of our index which bears watching. The economy remains too strong to recess, and too weak to grow.
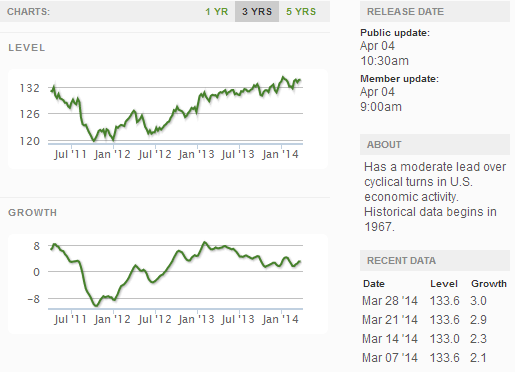
The ECRI WLI growth index value has been weakly in positive territory for many months - but now in a noticeable improvement trend. The index is indicating the economy six month from today will be slightly better than it is today.
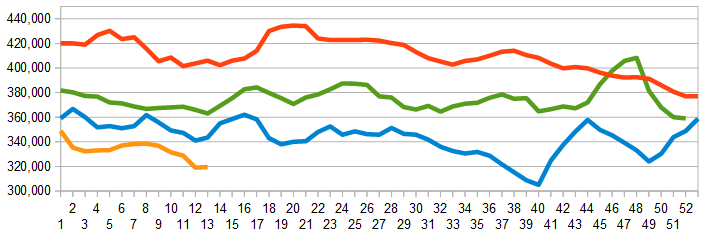
Initial unemployment claims went from 311,000 (reported last week) to 326,000 this week. Historically, claims exceeding 400,000 per week usually occur when employment gains are less than the workforce growth, resulting in an increasing unemployment rate. The real gauge – the 4 week moving average – marginally improved from 319,250 (reported last week as 317,750) to 319,500. Because of the noise (week-to-week movements from abnormal events AND the backward revisions to previous weeks releases), the 4-week average remains the reliable gauge.
Weekly Initial Unemployment Claims - 4 Week Average - Seasonally Adjusted - 2011 (red line), 2012 (green line), 2013 (blue line), 2014 (orange line)
Bankruptcies this Week: none
Weekly Economic Release Scorecard:
Click here to view the scorecard table below with active hyperlinks
