General Electric (NYSE:GE) is one of those stocks which engenders strong opinions on both sides. Adamant investors believe it is cheap, remembering the glory days of $40 per share and more. Indeed, their support for the stock is largely premised on this single fact alone.
On the other side, are those investors who believe GE is doomed and set to fall further as the fundamentals weigh ever more heavily. Which is why it’s no surprise to find posts on various sites such as ‘five reasons to buy and five reasons to sell GE.’
So who is correct? Heart or head?
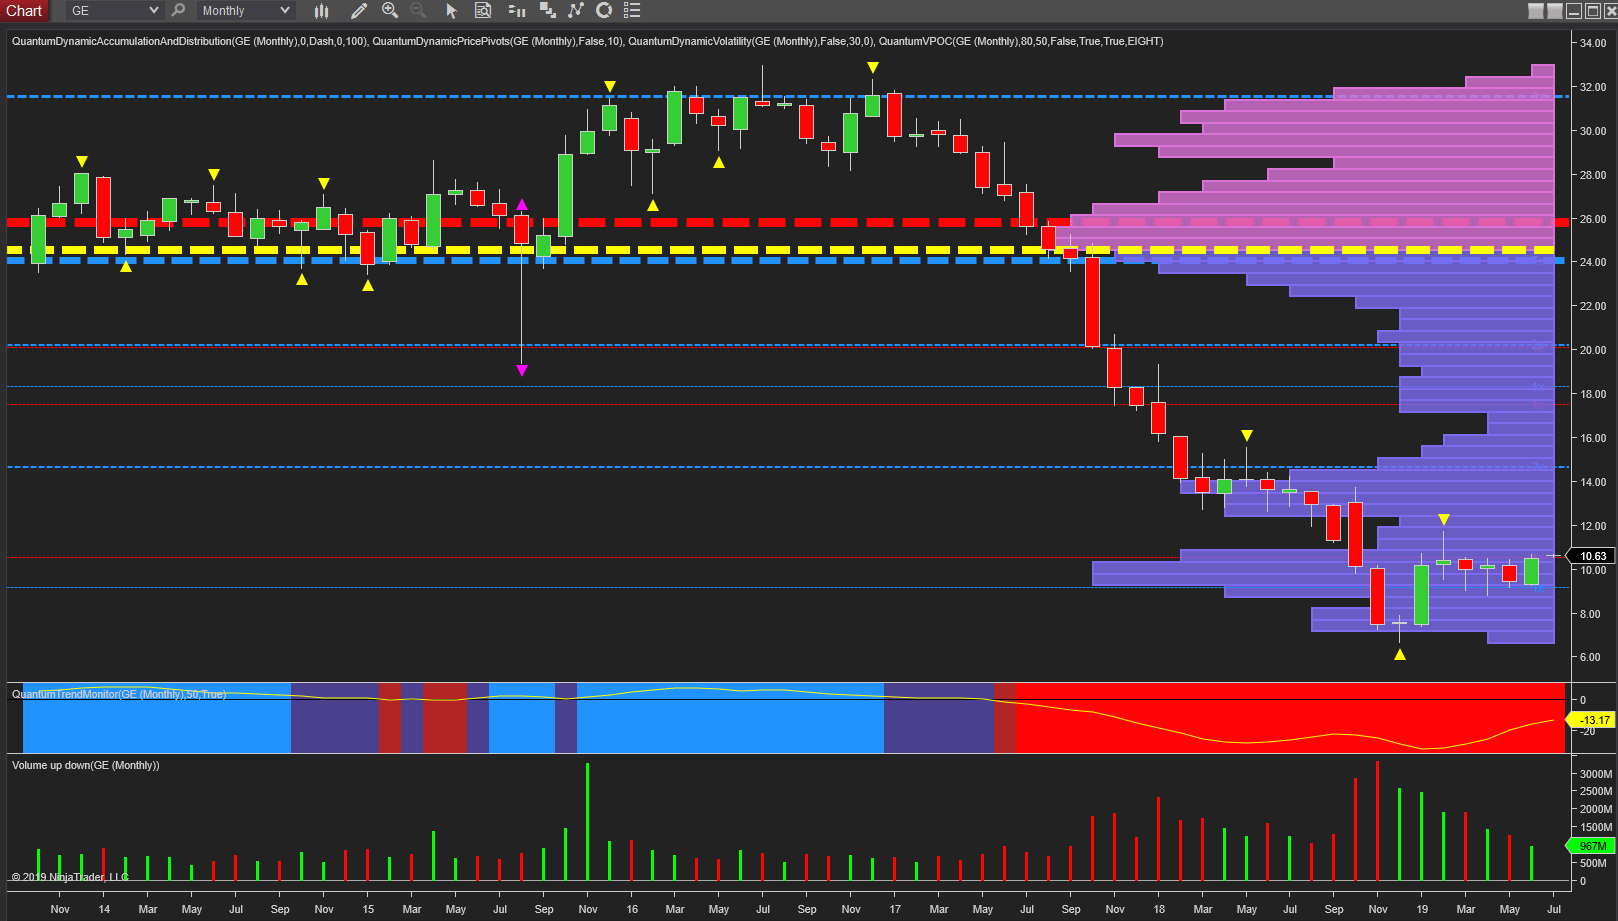
At $10.63 the stock looks very ‘cheap’ for a renowned blue chip, but so did Marconi who went from boom to bust in a very short time!
So in an effort to provide some kind of answer let’s start with the monthly chart and focus on the technical picture which is mixed, to say the least. The ‘turning point’ in the long bearish trend was the price action of November, December and January, which created a classic three candle pattern, consisting of a down and up candle either side of an evening star with excellent volume on the up candle.
February was less positive with the rally stalling and since then, congestion has followed with the ceiling of resistance now building at $10.63 per share. However, note the months where price fell and then recovered, on good volume, a sign of market maker buying.
Last month’s price action was once again positive, with a positive close and no wicks to the candle supported by good volume. From this price action, we should begin to see a rally from this platform of potential support.

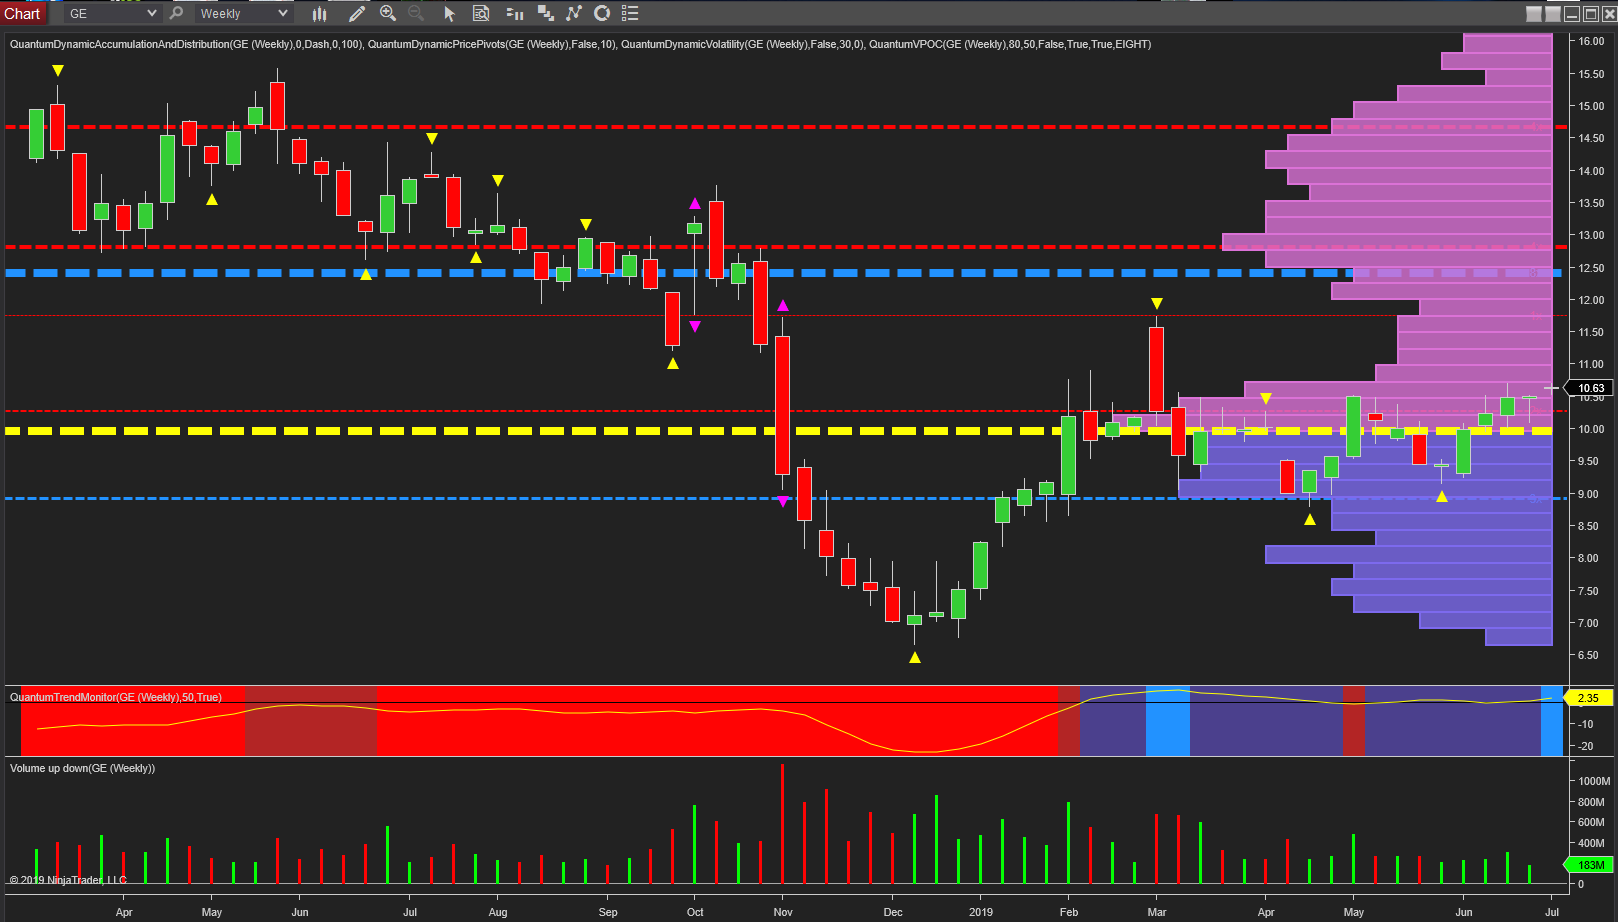
Moving to the weekly chart, this provides a more ‘micro view’ of the current balance of sentiment and there are several key issues here. First, note the volume point of control, the yellow dashed line, is centered in the $10 region and denotes the heaviest transacted volume and where the price is in agreement.
Notice the decent platform on support at $9.00 per share and based on last week’s price action we want to see a move away from this area, on rising volume which signals market maker participation, with $11 per share the next key level. Why? Because this is where we have low volume on the VPOC indicator, and so once into this area, the price should move up relatively easily and towards the next key level at $12.45 per share.
Here we have a strong area of price based resistance denoted with the blue dashed line of the accumulation and distribution indicator. This is very wide, and therefore signals a strong region which is likely to halt any progress higher, or at least act as a temporary barrier. Finally, note the trend monitor indicator which has now transitioned to bright blue helping to confirm and support the shift in sentiment which is slowly transitioning to bullish on this timeframe.
