Get 40% Off
🚨 Volatile Markets? Find Hidden Gems for Serious OutperformanceFind Stocks Now

Is A Growth Scare Just Around The Corner?

Published 05/27/2014, 12:09 AM
Updated 07/09/2023, 06:31 AM

As Joe Wiesenthal recently noted, it's the moment of truth for the US recovery and expectations are rising for faster growth:

All the pieces are in place for the U.S. The fiscal drag is fading. Household balance sheets have improved. State and local bloodletting is coming to an end. If not now, when?

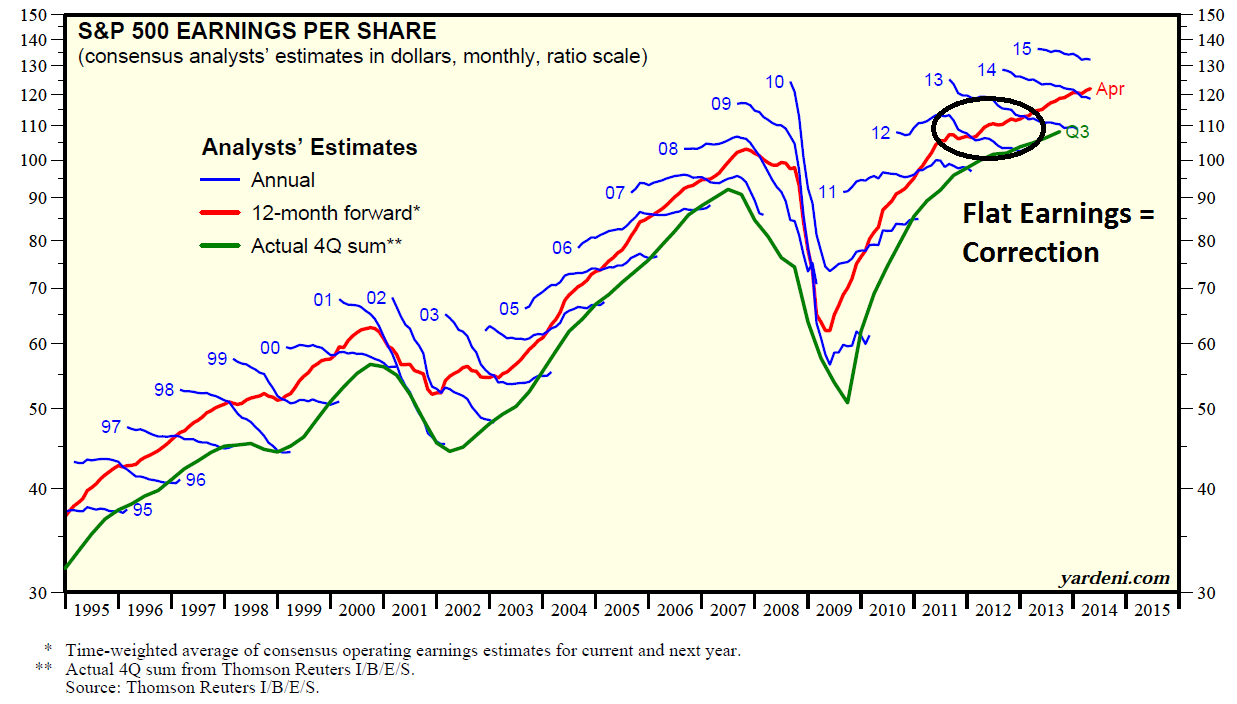
Indeed, the major US large cap equity averages pushed to new highs last week. The fundamentals appeared positive and supportive of the advance. Notwithstanding any unexpected shocks from the Fed, what really matters to stock prices are earnings. Ed Yardeni`s analysis shows that forward 12 month earnings continue to rise, while past periods of flat growth in 2011 and 2012 have been marked by market corrections.

S&P 500 EPS
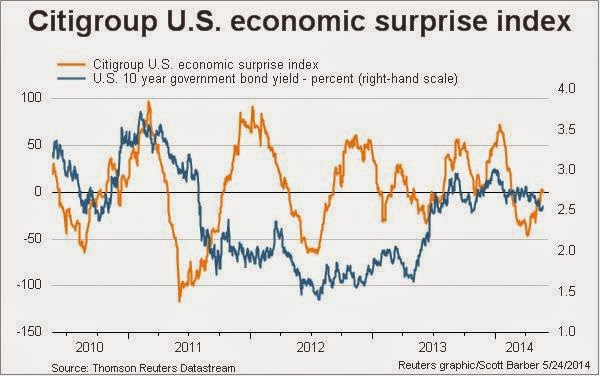
The Citigroup US Economic Surprise Index has been advancing, as the rate of high frequency, economic beat-to-miss-rate rises.
Economic Surprise Index vs 10-Year Yield
So far, so good for the bull case.

Signs of weakness

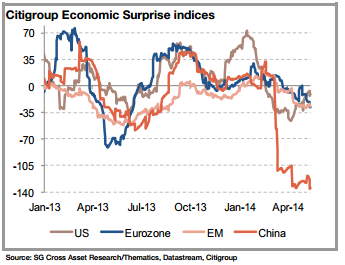
However, there are signs of weakness beneath the surface. Global growth is slowing. Societe Generale (via Pragmatic Capitalism) showed that the Citigroup Economic Surprise Index has been weak everywhere except for the US. Could a global macro growth slowdown be around the corner?

Global Economic Surprise Indices
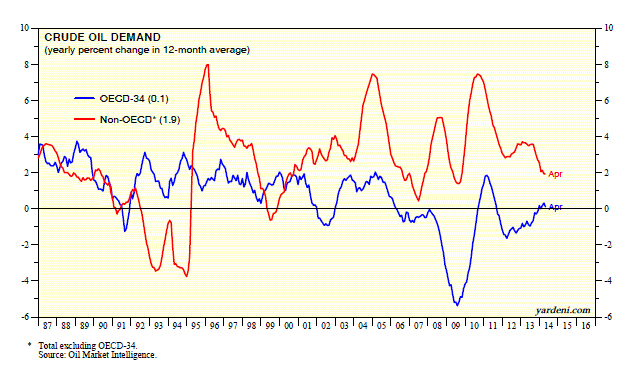
Ed Yardeni also pointed to signs of a global growth slowdown from falling oil demand:
Crude Oil Demand
The US economy is in the mid-cycle of its expansion. This part of the cycle "should" be marked by rising employment and consumer spending, as well as increased capital expenditure and capacity expansion. Yet, we have seen scant evidence of the CapEx rebound (see What the equity bull needs for the next phase and CapEx: Still waiting for Godot). The recent CAT report indicating sluggish sales growth continues to be a disappointment in that respect.
3rd party Ad. Not an offer or recommendation by Investing.com. See disclosure here or remove ads .

I have detailed in this blog over the last several weeks the technical concerns I have had about this stock market (see The bearish verdict from market cycle analysis and Market correction or consolidation?). I wrote that one of the key "tells" of the health of this latest bullish impulse is the performance of mid-cycle cyclical and capital equipment stocks.

The warning from cyclical stocks


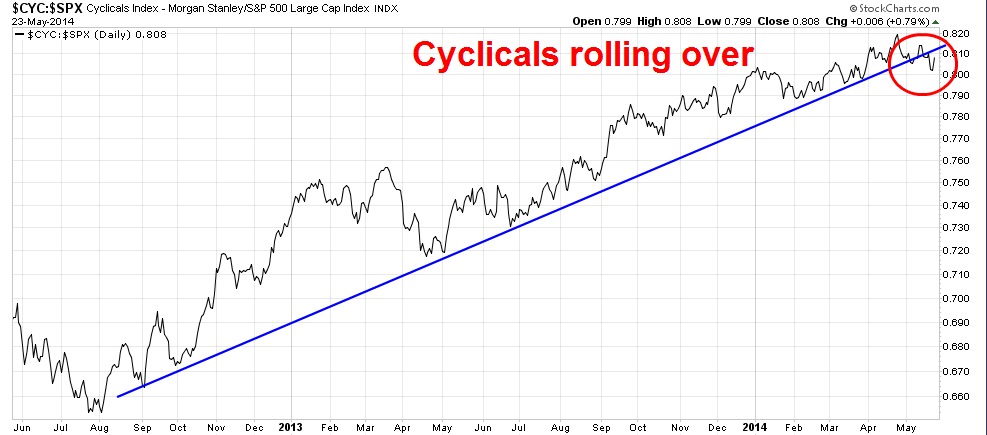
Last week, they cracked, even as the major averages rallied to new all-time highs. The chart below of the relative performance of the Morgan Stanley Cyclical Index (CYC) show that cyclical stocks have definitively broken down out of a relative uptrend. Up until recently, it could be argued that the relative uptrend was a little wobbly but remained intact. The latest technical verdict from last week's market action was clear. No matter how you manipulate the trend line, the technical break was unmistakable.

CYC vs SPX Daily
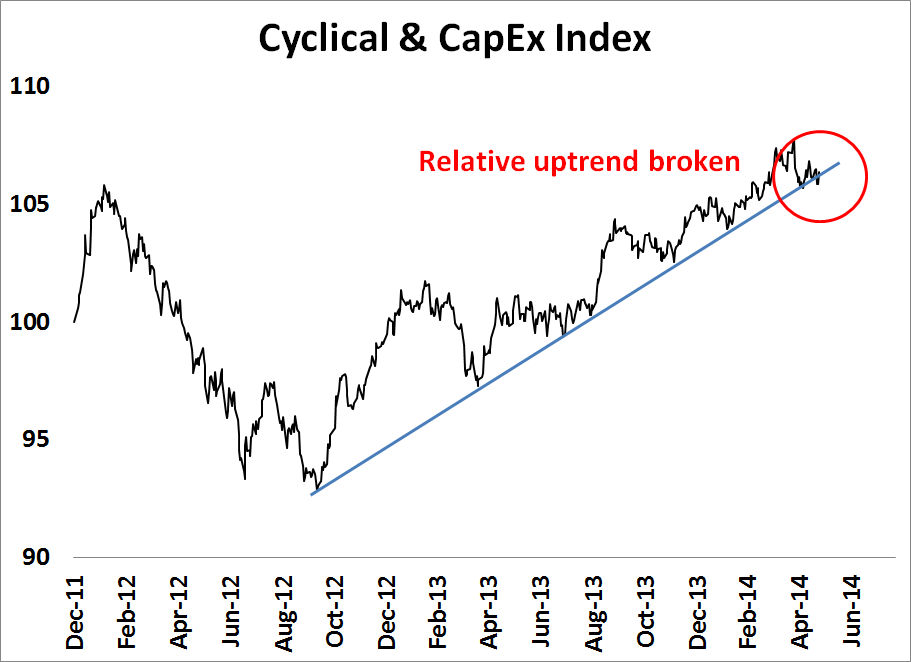
As confirmation, I constructed an equal-weighted Cyclical and CapEx Index consisting of CYC, Industrial stocks (Industrial Sector SPDR Trust (ARCA:XLI)) and semi-conductor stocks (HOLDRS Merrill Lynch Semiconductor (NYSE:SMH)) and measured their performance against the market.
 
As the chart below shows, this composite index also showed a technical breakdown out of its relative uptrend.
Cyclical and CapEx Index: December 2011-Present
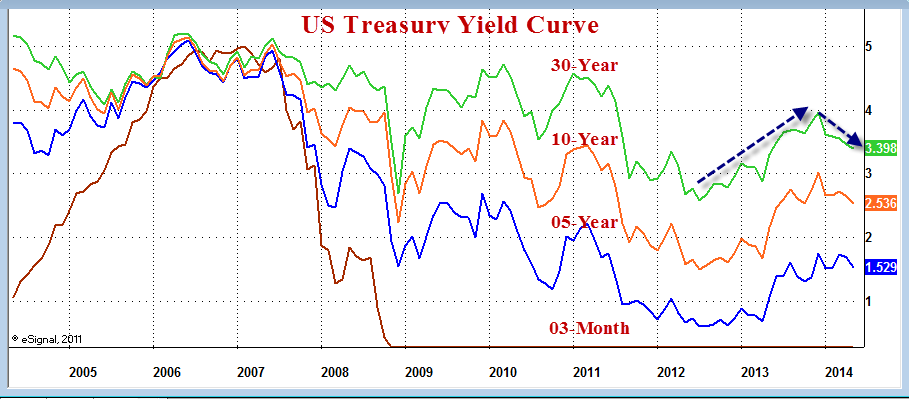
In addition, Mish pointed out that Treasury yields have been falling, not rising. While a falling long bond yield could be explained by pension funds buying long duration assets in order to lock in last year's stock market gains (see my previous post A funds-flow reason for equity market weakness), an across the board decline in bond yields is more likely to explained by Mr. Bond Market anticipating economic deceleration, not acceleration.
3rd party Ad. Not an offer or recommendation by Investing.com. See disclosure here or remove ads .
U.S Treasury Yields 2005-2014
These warnings from cyclical stocks and the bond market suggest to me that the US is unlikely to be able to de-couple from the rest of the world. A global growth slowdown will eventually affect the US economy and the markets are starting to price in that possibility.

Watch estimate revisions!

I have also thought of technical analysis as a branch of behavioral finance. In effect, the technical condition of the market tells me the state of market expectations. Right now, we have:

  • Early cycle interest sensitive sectors rolling over after leading the market higher from the 2011 trough;
  • Mid cycle sectors like Consumer Discretionary have weakened; 
  • Business-related mid cycle sectors like Cyclical and Industrial stocks are now starting to lose their leadership status;
  • Late cycle sectors such as Materials and Energy are turning up on a relative basis; and
  • Defensive bear market sectors such as Utilities and Consumer Staples have become the market leadership.
 
Current conditions have market fundamentals and technicals disagreeing. Market fundamentals point to a continued expansion, while market technical conditions are highly suggestive of a growth slowdown. I don`t know if a slowdown will unfold, but as an example Across the Curve featured a Barron's interview with Stephanie Pomboy who postulated a US slowdown based on the removal of QE:
Barron’s interviewed Stephanie Pomboy of Macro Mavens this week and she presented an especially bearish view on the US economy. She argues that as the Federal Reserve stops buying Treasuries the economy will falter and the Fed might even taper the taper. She thinks there is little upside to Treasury yields and believes that the 10 year will be trapped between 2 percent and 3 percent for a long time.
3rd party Ad. Not an offer or recommendation by Investing.com. See disclosure here or remove ads .
 
Is a growth scare just around the corner? If so, we will see the first signs of fundamental deterioration if consensus forward earnings start to get revised downward. We have already had a warning from the relative performance of cyclical stocks. The next thing to do is to watch the estimate revision rate.

Disclosure: Cam Hui is a portfolio manager at Qwest Investment Fund Management Ltd. (“Qwest”). The opinions and any recommendations expressed in the blog are those of the author and do not reflect the opinions and recommendations of Qwest. Qwest reviews Mr. Hui’s blog to ensure it is connected with Mr. Hui’s obligation to deal fairly, honestly and in good faith with the blog’s readers.”

None of the information or opinions expressed in this blog constitutes a solicitation for the purchase or sale of any security or other instrument. Nothing in this blog constitutes investment advice and any recommendations that may be contained herein have not been based upon a consideration of the investment objectives, financial situation or particular needs of any specific recipient. Any purchase or sale activity in any securities or other instrument should be based upon your own analysis and conclusions. Past performance is not indicative of future results. Either Qwest or I may hold or control long or short positions in the securities or instruments mentioned.

Latest comments

Risk Disclosure: Trading in financial instruments and/or cryptocurrencies involves high risks including the risk of losing some, or all, of your investment amount, and may not be suitable for all investors. Prices of cryptocurrencies are extremely volatile and may be affected by external factors such as financial, regulatory or political events. Trading on margin increases the financial risks.
Before deciding to trade in financial instrument or cryptocurrencies you should be fully informed of the risks and costs associated with trading the financial markets, carefully consider your investment objectives, level of experience, and risk appetite, and seek professional advice where needed.
Fusion Media would like to remind you that the data contained in this website is not necessarily real-time nor accurate. The data and prices on the website are not necessarily provided by any market or exchange, but may be provided by market makers, and so prices may not be accurate and may differ from the actual price at any given market, meaning prices are indicative and not appropriate for trading purposes. Fusion Media and any provider of the data contained in this website will not accept liability for any loss or damage as a result of your trading, or your reliance on the information contained within this website.
It is prohibited to use, store, reproduce, display, modify, transmit or distribute the data contained in this website without the explicit prior written permission of Fusion Media and/or the data provider. All intellectual property rights are reserved by the providers and/or the exchange providing the data contained in this website.
Fusion Media may be compensated by the advertisers that appear on the website, based on your interaction with the advertisements or advertisers.
© 2007-2024 - Fusion Media Limited. All Rights Reserved.