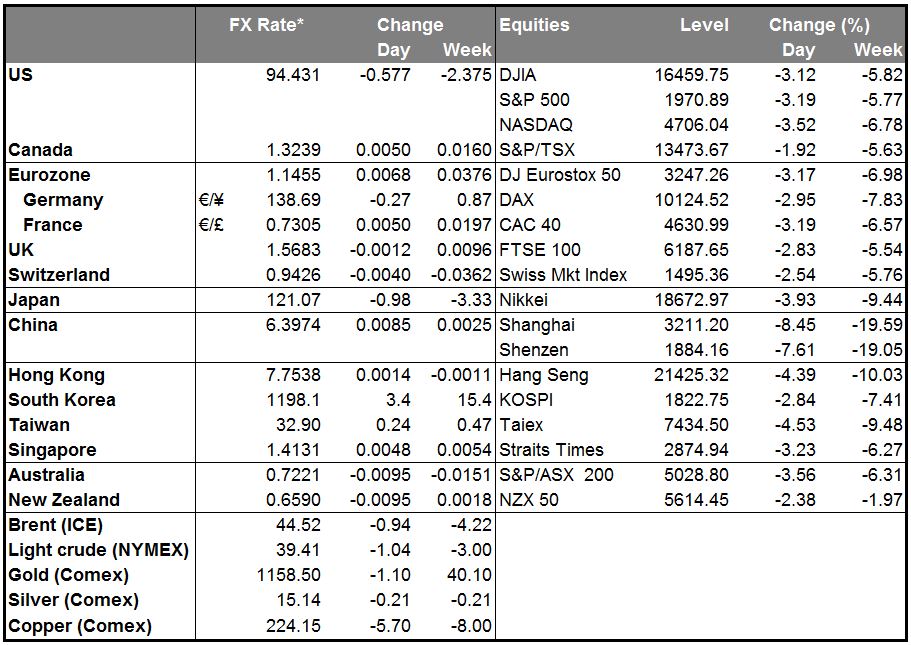
- Euro and yen rally as Global stocks slump EUR and JPY are gaining from both, the sell-off in Asian stock markets caused primarily by China’s unexpected move to devalue yuan, and from falling expectations that the Fed will raise interest rates in September. The probability that Fed will hike has lessened from around 50% before China’s move to 28% on Monday. Even though China can be seen as the main reason why the global equities have plunged, other key factors help to maintain the slide. The slump in oil and other commodity prices, which increase deflationary pressures, and the currency devaluations in EM on global growth concerns. As fears of a global economic slowdown build up, investors move from riskier assets in EM to less risky DM government bonds.
- Today, we have a very light calendar day. The only noteworthy indicator we get is the US Chicago Fed National activity index for July. With no forecast available, the market reaction is likely to stay limited at this release.
- As for the speakers, Atlanta Fed President Dennis Lockhart speaks. The uncertain tone of the July FOMC meeting minutes suggested that the policy makers were somewhat less likely to raise rates at their September meeting, mainly due to concerns over inflation. Hence, investors are likely to pay more attention on Fed speakers, for clues if the time for the first rate hike is indeed “approaching.”
- As for the rest of the week, on Tuesday, NZD could come under renewed selling pressure given the 2-year inflation expectation for Q3 is to be released. As expectations for another rate cut by the RBNZ build-up, a weak figure would add to the growing evidence that the economy of New Zealand is losing momentum.
- The German Ifo survey for August is also coming out. The German ZEW survey for August showed a mixed picture for the bloc’s strongest economy. The expectations index declined once again from the previous month, while the moderate increase in the current situation index was not enough to reverse investors’ disappointment. The latest sell-off in the global stock markets, the fresh tensions in emerging markets and the renewed instability in Greece, could put further downside pressure in the expectations index. Therefore, a weak Ifo reading could add to evidence that the bloc’s growth engine is losing steam.
- On Wednesday, in the US, durable goods orders for July are expected to have fallen, a turnaround from the month before, while durable goods excluding transportation equipment are estimated to decelerate somewhat. The focus is usually on the core figure, where a positive surprise is needed to suggest the possible start of a turnaround in business investment and strengthen the dollar.
- On Thursday, the main event will be the 2nd estimate of US Q2 GDP. The forecast is for the growth rate to be revised up, to show that the US economy expanded at a faster pace from the already encouraging growth figure seen in the first estimate. This is in line with the Fed’s expectations for a stronger Q2 growth, and could provide a boost to USD.
- On Friday, we have the usual end-of-month data dump from Japan. The focus will be on the National CPI rate for July and the Tokyo CPI rate for August as BoJ officials’ showed optimism that the inflation will accelerate considerably in the coming months. Therefore, a rise in the CPI could strengthen JPY somewhat. At the same time, we get Japan’s jobless rate and job-offers-to-applicants’ ratio, also for July.
- From Germany, the preliminary CPI for August is coming out. As usual, we will look at the larger regions for a guidance on where the headline figure may come in and thereby as an indication for the near-term direction of EUR. A rise in the German CPI rate could indicate a rise in the Eurozone’s CPI to be released next week and strengthen EUR a bit.
- In the UK, the 2nd estimate of Q2 GDP is expected to confirm the preliminary growth figure and show that the economy grew 0.7% qoq in Q2. Coming on top of the recent encouraging data, this could add steam to the UK’s recovery and strengthen GBP somewhat.
- In the US, we get the personal income and personal spending for July. Personal income is expected to have risen at the same pace as in June, while personal spending is forecast to have accelerated. The focus is usually on personal spending and a significant positive surprise is needed for the USD to remain supported.
The Market
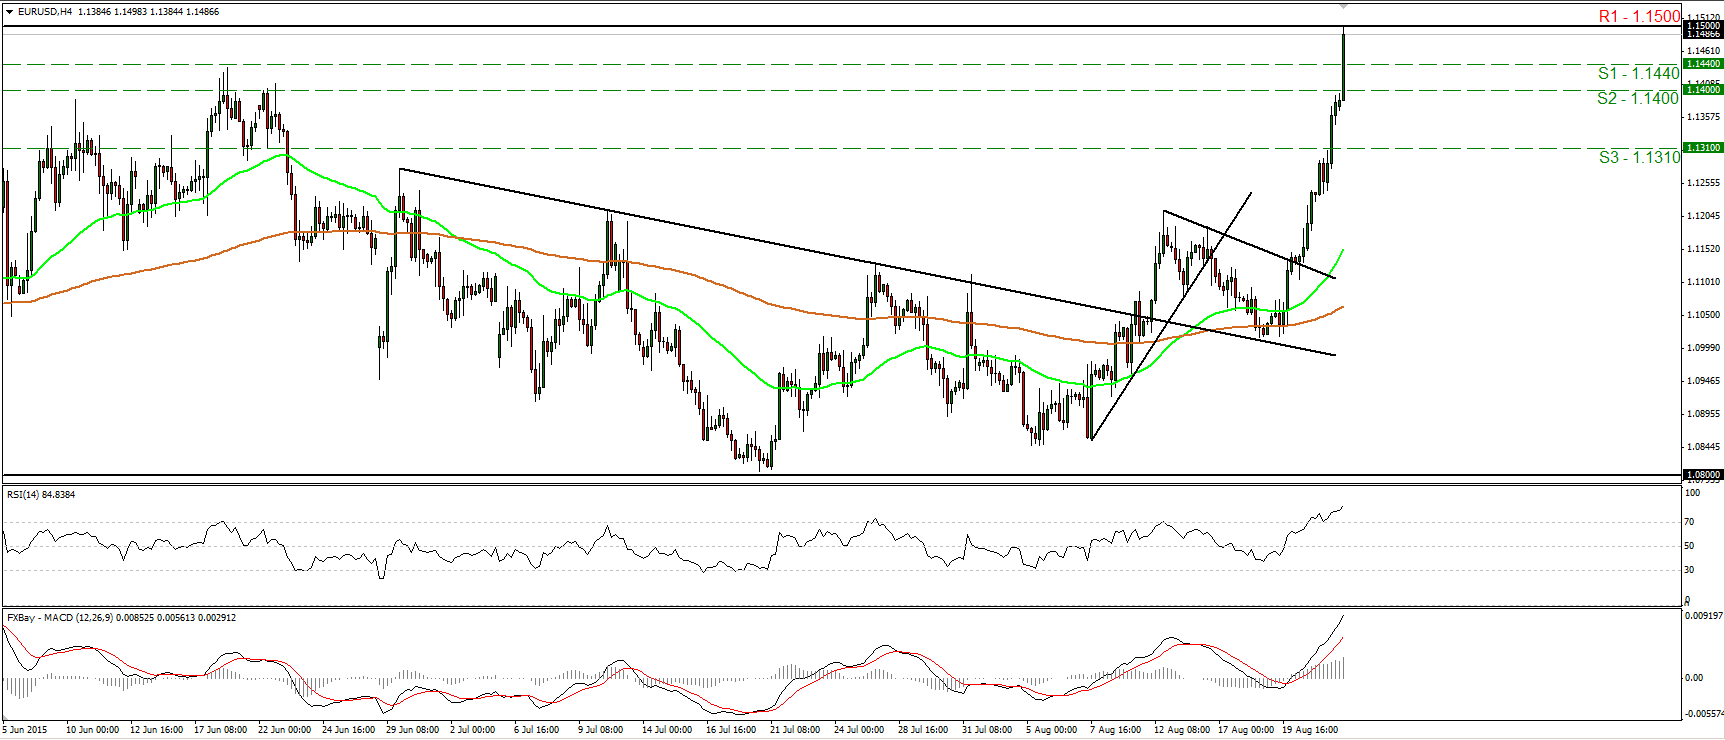
EUR/USD continues its rally and hits 1.1500
- EUR/USD continued its surge on Friday, reaching the psychological round barrier of 1.1500 (R1). The short-term bias remains positive, but I prefer to see a clear close above 1.1500 (R1) before I get more confident on the continuation of the rally. Something like that could see scope for extensions towards our next resistance of 1.1650 (R2). Our short-term oscillators detect strong upside speed and support the short-term picture. The RSI rebounded from its 70 line and point north, while the MACD continued higher, well above both its zero and signal lines. As for the broader trend, as long as EUR/USD is trading between 1.0800 and 1.1500 (R1), I would consider the longer-term picture to stay flat. I believe that a close above the psychological zone of 1.1500 (R1) is the move that could carry larger bullish implications, while a break below 1.0800 is needed to confirm a forthcoming lower low on the daily chart and perhaps turn the overall bias back to the downside.
- Support: 1.1440 (S1), 1.1400 (S2), 1.1310 (S3)
- Resistance: 1.1500 (R1), 1.1650 (R2), 1.1725 (R3)
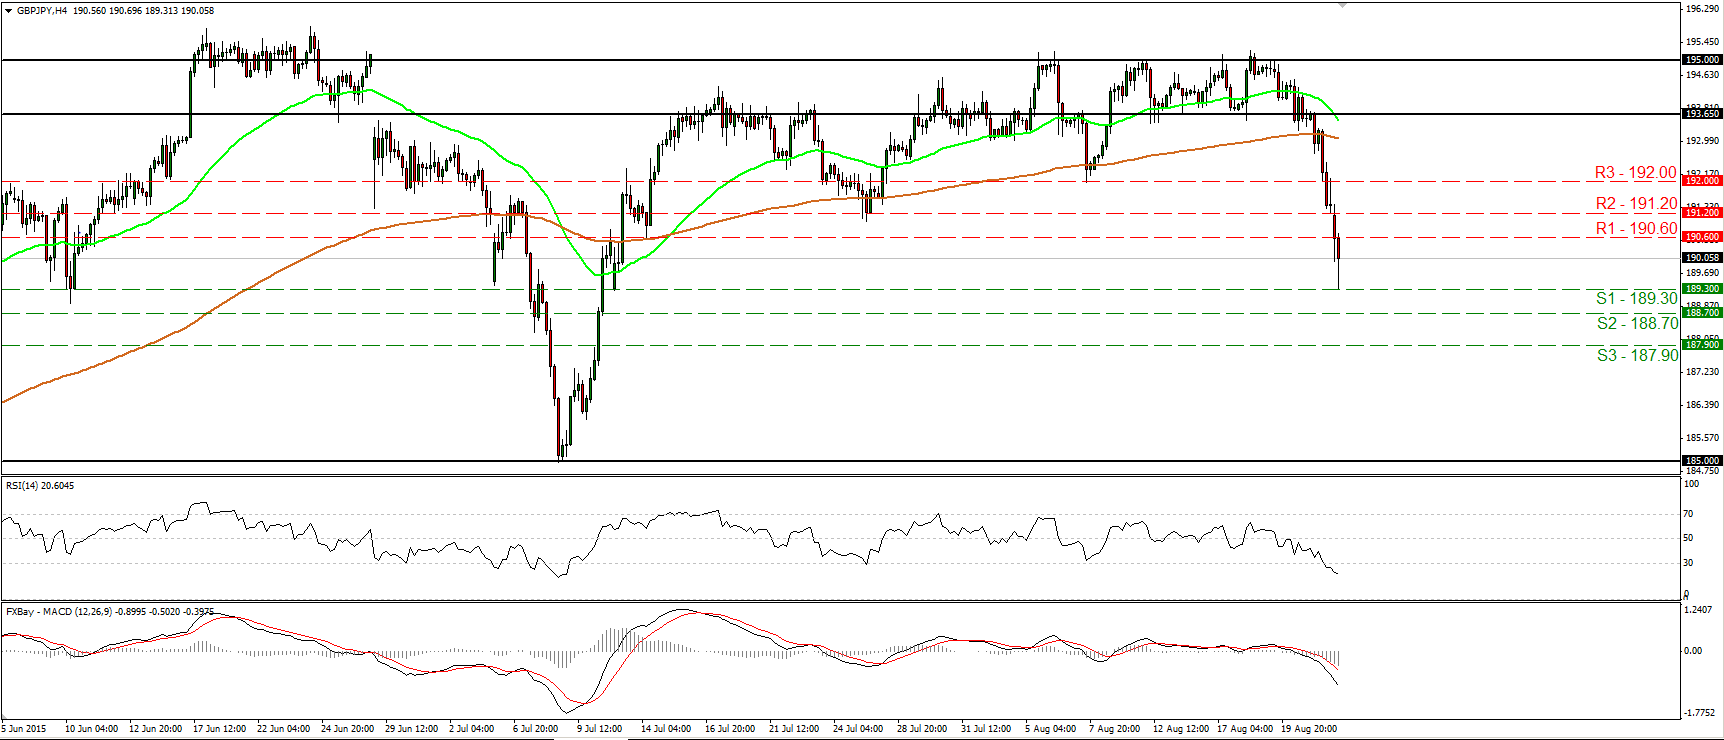
GBP/JPY collapses and hits support at 189.30
- GBP/JPY continued collapsing on Friday, and today during the early European morning, the pair hit support at 189.30 (S1). The short-term bias remains to the downside, thus, I would expect a clear break below 189.30 (S1) to initially target the next support at 188.70 (S2). Another break below that line is likely to extend the short-term downtrend towards the 187.90 (S3) hurdle. The RSI fell below 30 and points south, while the MACD stand well below both its zero and trigger lines, pointing down as well. As for the broader trend, the recent plunge confirmed a lower high on the daily chart, therefore I would switch my stance to neutral as far as the overall picture is concerned. I believe that a break below the psychological zone of 185.00 is needed to bring a major trend reversal.
- Support: 189.30 (S1), 188.70 (S2), 187.90 (S3)
- Resistance: 190.60 (R1), 191.20 (R2), 192.00 (R3)
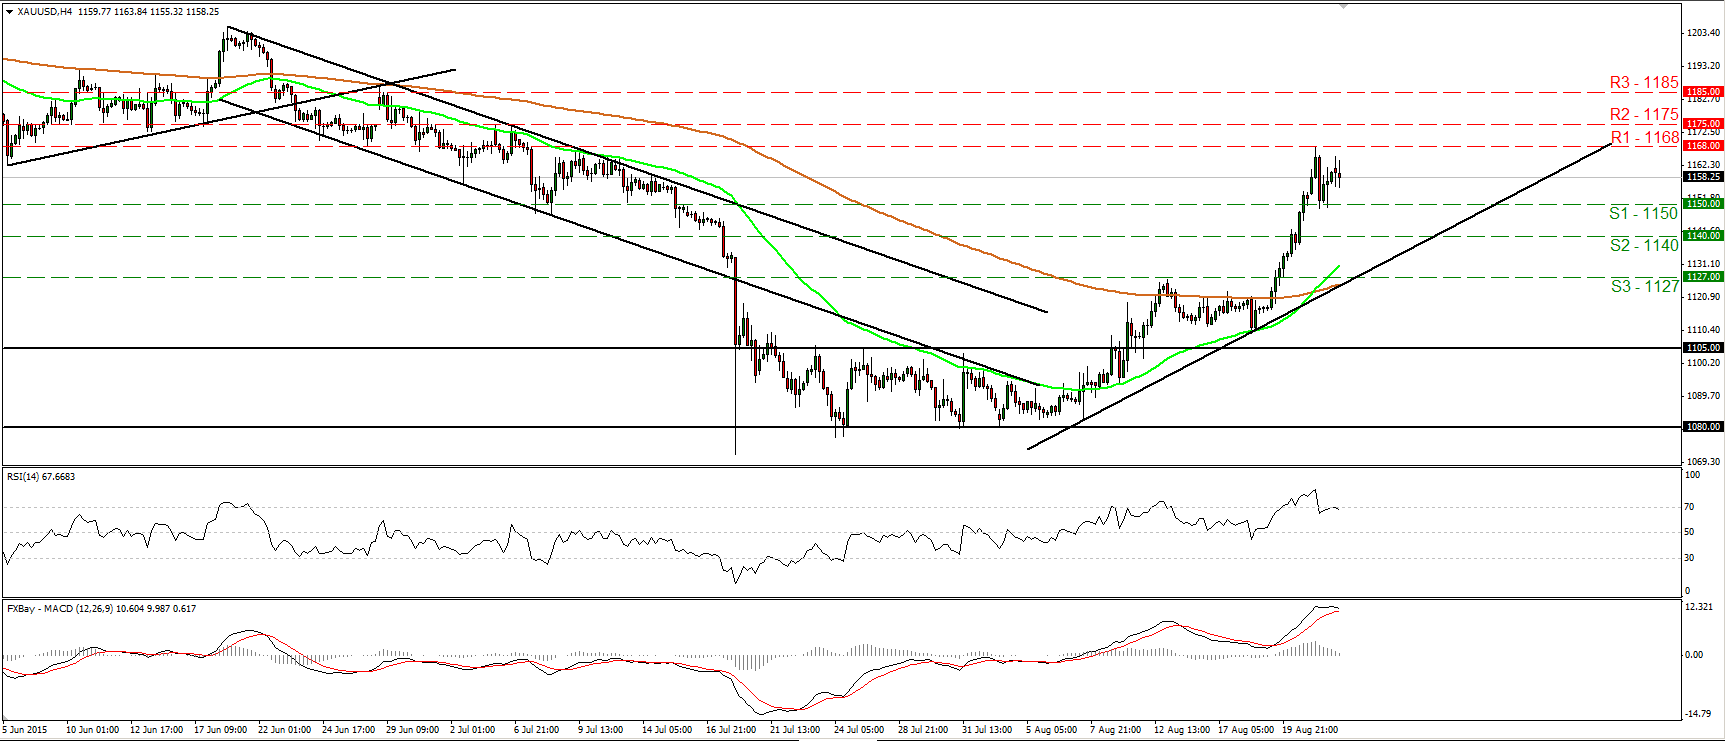
Gold pulls back after hitting 1168
- Gold traded lower on Friday, after it hit resistance at 1168 (R1). The retreat was halted at 1150 (S1) and then the metal rebounded somewhat. The short-term picture is still positive in my opinion and as a result, I would expect a move above 1168 (R1) to initially target the 1175 (R2) hurdle. Taking a look at our short-term oscillators though, I see signs that another pullback could be on the cards before the next positive leg. A clear dip below 1150 (S1) is likely to confirm the case and perhaps pave the way towards the 1140 (S2) barrier. The RSI exited its above-70 territory, while the MACD has topped and could fall below its trigger line soon. As for the bigger picture, having in mind that Thursday’s rally brought the metal above the downside resistance line taken from the peak of the 18th of May, I would switch my stance to neutral as far as the overall picture is concerned.
- Support: 1150 (S1), 1140 (S2), 1127 (S3)
- Resistance: 1168 (R1), 1175 (R2), 1185 (R3)
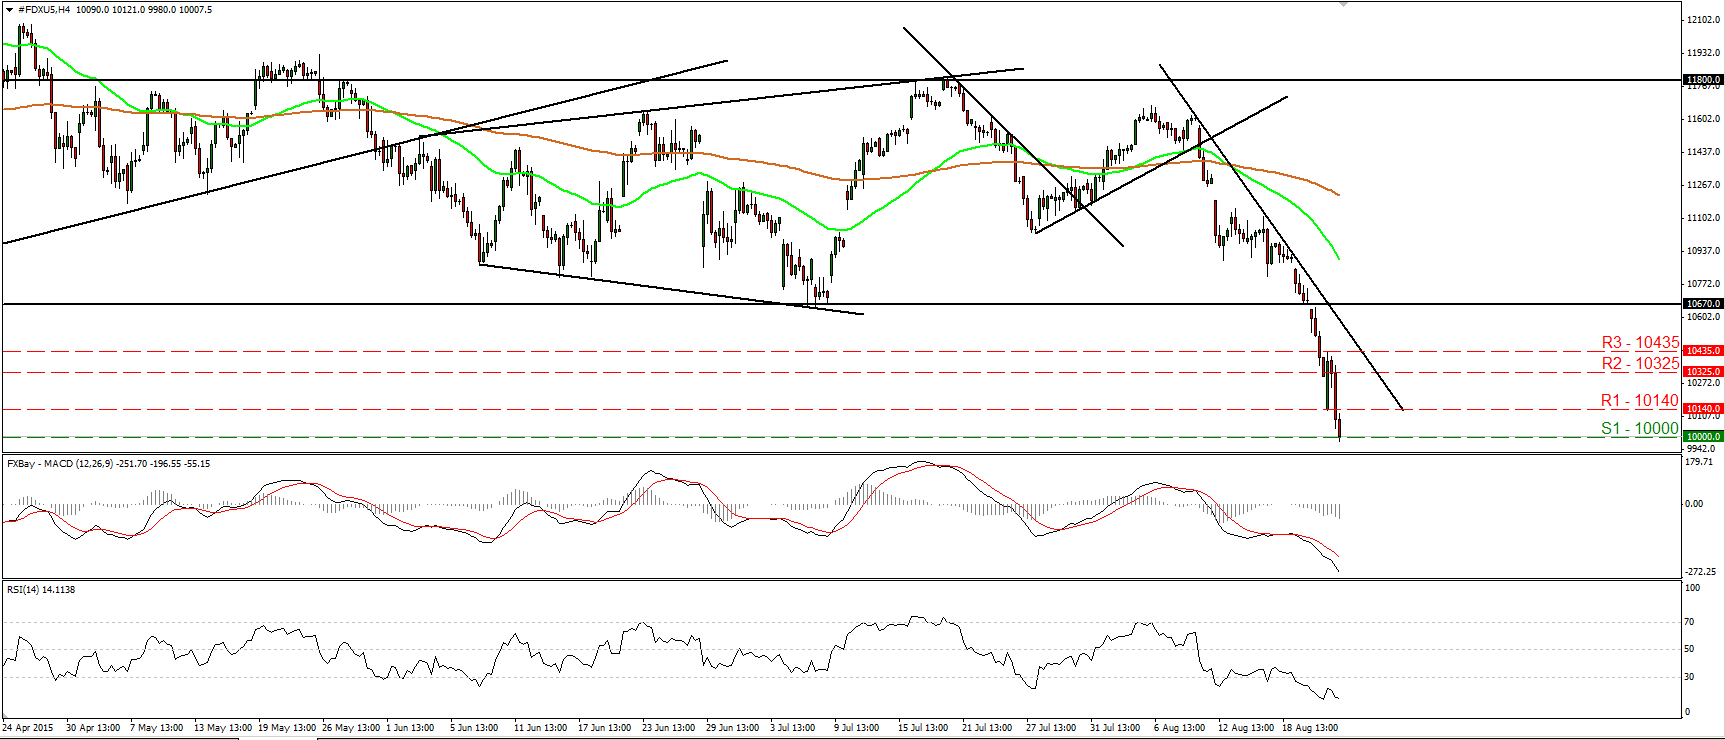
DAX hits support near 10000
- DAX extended its losses after falling below the key obstacle of 10670. During the early European morning Monday, the index is testing the psychological round figure of 10000 (S1), where a clear break is likely to set the stage for more bearish extensions, perhaps towards the 9770 (S2) zone. Our oscillators reveal strong downside momentum and amplify the case that the index could fall below 10000 (S1) in the near future. The RSI stands below its 30 line and points down, while the MACD, at extreme low levels, stands below its trigger line and points south as well. On the daily chart, I believe that the break below 10670 has shifted the medium-term outlook to the downside. Therefore, I would expect the index to continue to trade lower in the not-to-distant future.
- Support: 10000 (S1), 9770 (S2), 9600 (S3)
- Resistance: 10140 (R1) 10325 (R2), 10435 (R3)
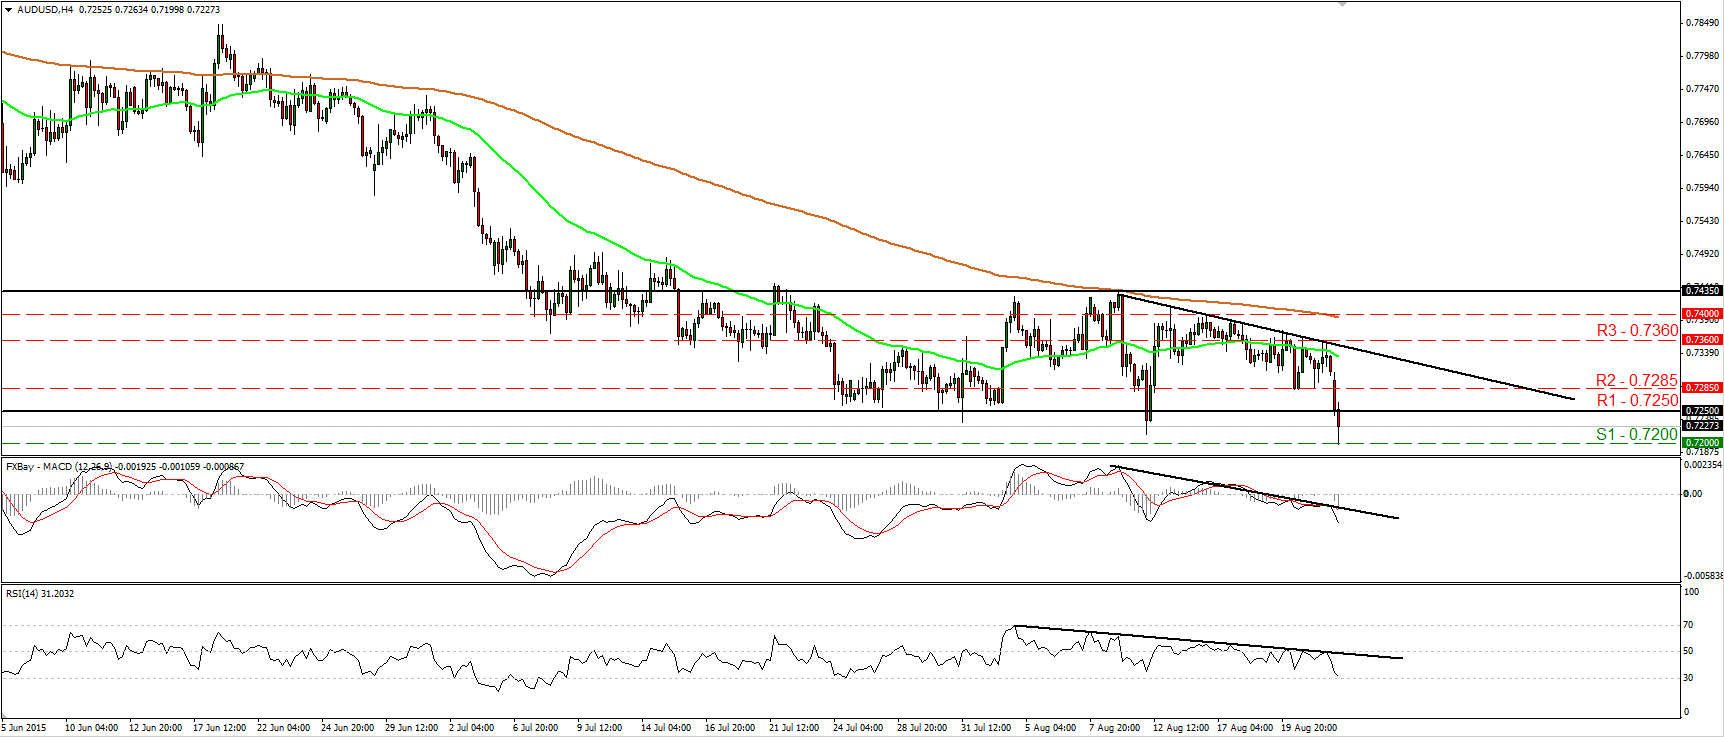
AUD/USD breaks below 0.7250 and hits support at 0.7200
- AUD/USD traded lower during the Asian morning Monday, breaking below 0.7250 (R1) and hitting support at 0.7200 (S1). I believe that the short-term bias has turned negative again and as a result, I would expect a clear move below 0.7200 (S1) to open the way towards 0.7100 (S2). Our short-term momentum indicators support the notion. The RSI slid after it hit resistance near its 50 barrier, while the MACD, already negative, has fallen below its trigger line. On the daily chart, the completion of a head and shoulders formation and the move below the psychological zone of 0.7500 signaled the continuation of the prevailing long-term downtrend, in my opinion. The break below 0.7250 (R1) confirmed a forthcoming lower low on the daily chart, and this supports the case that AUD/USD could eventually trade lower and perhaps aim for the psychological zone of 0.7000 (S3).
- Support: 0.7200 (S1), 0.7100 (S2), 0.7000 (S3)
- Resistance: 0.7250 (R1), 0.7285 (R2), 0.7360 (R3)

