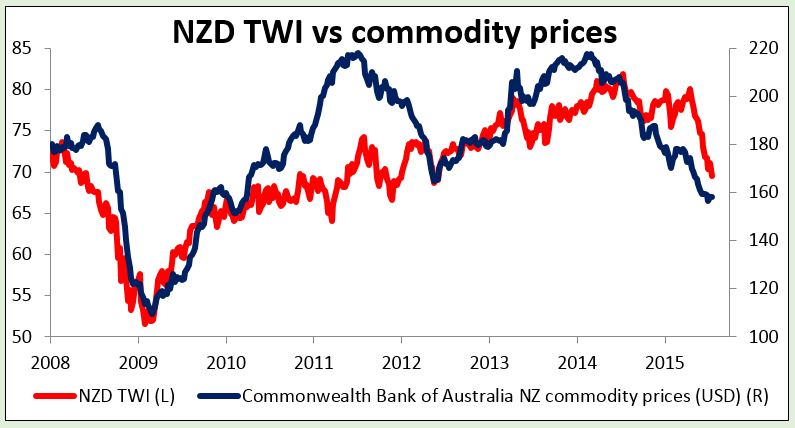
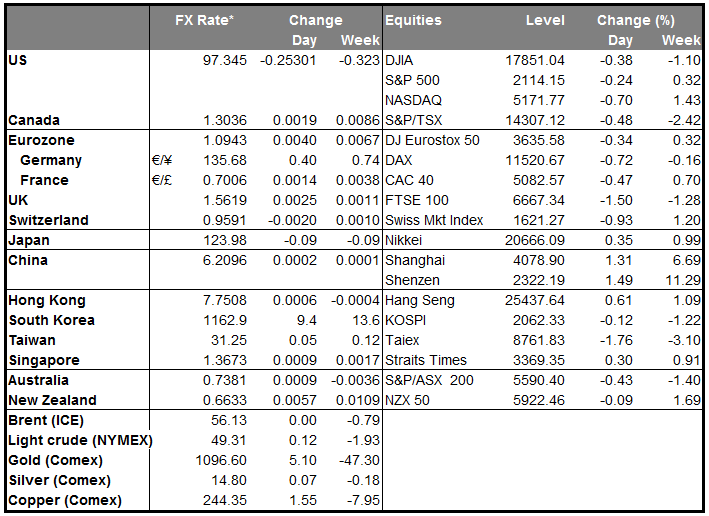
•RBNZ cuts rates, says further easing likely; NZD gains The Reserve Bank of New Zealand (RBNZ) cut rates by 25 bps overnight and said that “some further easing seems likely.” This was a stronger easing bias than last month, when they said that “(w)e expect further easing may be appropriate” depending on the data. Nonetheless, the NZD gained, as the market had put a 34% probability on a 50 bps cut. Furthermore, the statement was less aggressive on the NZD valuation. “The New Zealand dollar has declined significantly since April..,” the RBNZ observed. “While the currency depreciation will provide support to the export and import competing sectors, further depreciation is necessary given the weakness in export commodity prices.” The call for “further depreciation” is not as strong as in June, when the Bank said that “a further significant downward adjustment is justified.”
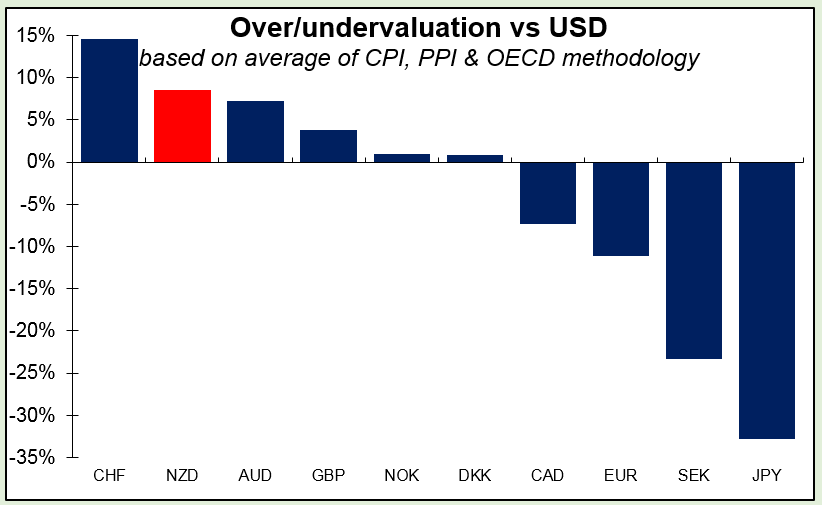
• Nonetheless, I think they are likely to see some “further depreciation” in NZD. The steep fall in the price of milk products, New Zealand’s major export, has worsened the country’s terms of trade. Furthermore, NZD remains highly overvalued on some measures of purchasing power parity (PPP), although, to be fair, it is slightly undervalued according to the OECD’s methodology. (It’s also a very cheap place to buy a Big Mac, if you like Big Macs.) I look for further depreciation in the currency at least vs USD, and perhaps even vs AUD as well.
• Other commodity currencies ease Aside from NZD, the other commodity currencies fell. CAD, for example, was the worst performing of the G10 currencies, while among EM currencies, BRL fell and USD/MXN extended further into record high territory, as oil continued to decline and many other commodities, including agricultural commodities such as soybeans, fell. The unexpected rise of 2.5mn barrels in US crude oil inventories in the latest week, despite a small decline in oil output, depressed oil prices and oil-related currencies. No sign of a change here in the near future!
• GBP best performing currency On the other hand, GBP was the best performing G10 currency, after yesterday’s Bank of England minutes showed an increasing split on the Monetary Policy Committee. “There were, however, differences of view as to how significant the increases in domestic cost pressures had been,” the minutes said. “For some, they were no more than a part of the increase that would be necessary in order for inflation to rise sufficiently to meet the 2% target after the commodity-related factors that were temporarily depressing it had waned. For others, it appeared as though domestic cost pressures had risen more quickly than expected which, combined with the view that spare capacity in the labor market was close to being exhausted." This suggests we could soon see some votes in favor of tightening.
• Today’s highlights: During the European day, Sweden’s unemployment rate for June is expected to increase somewhat. PES unemployment rate for the same month increased a bit, showing the potential direction of the official rate. Coming on top of the further dip into deflationary territory in June, the deteriorating fundamentals justify Riksbank’s decision at its 2 July meeting to cut interest rates further. An increase in the unemployment could add to these soft data and weaken SEK.
• In the UK, retail sales for June are forecast to accelerate. Following the acceleration seen in wages in April and May, retail sales could show some improvement. This may add to the positive sentiment towards the pound, given the rate hike expectations, and push sterling higher against its peers.
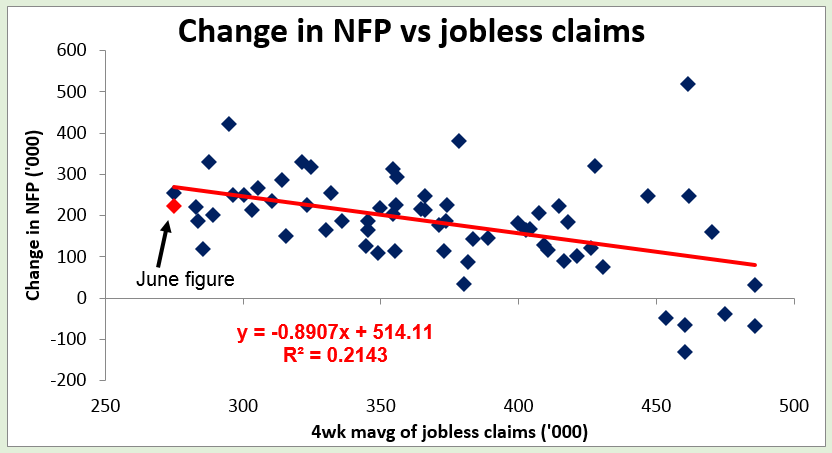
• From the US, we get the initial jobless claims for the week ended July 18 (survey week for the July NFP figures). Using our simple analysis of the value of the four-week moving average of jobless claims against the NFP figure, the latest figure (283k) would imply a NFP figure of some 260k – quite a robust number. Separately, the Chicago Fed National activity index for June and Conference Board leading index for June are also due to be released. The latter is expected to decelerate from the previous month.
The Market
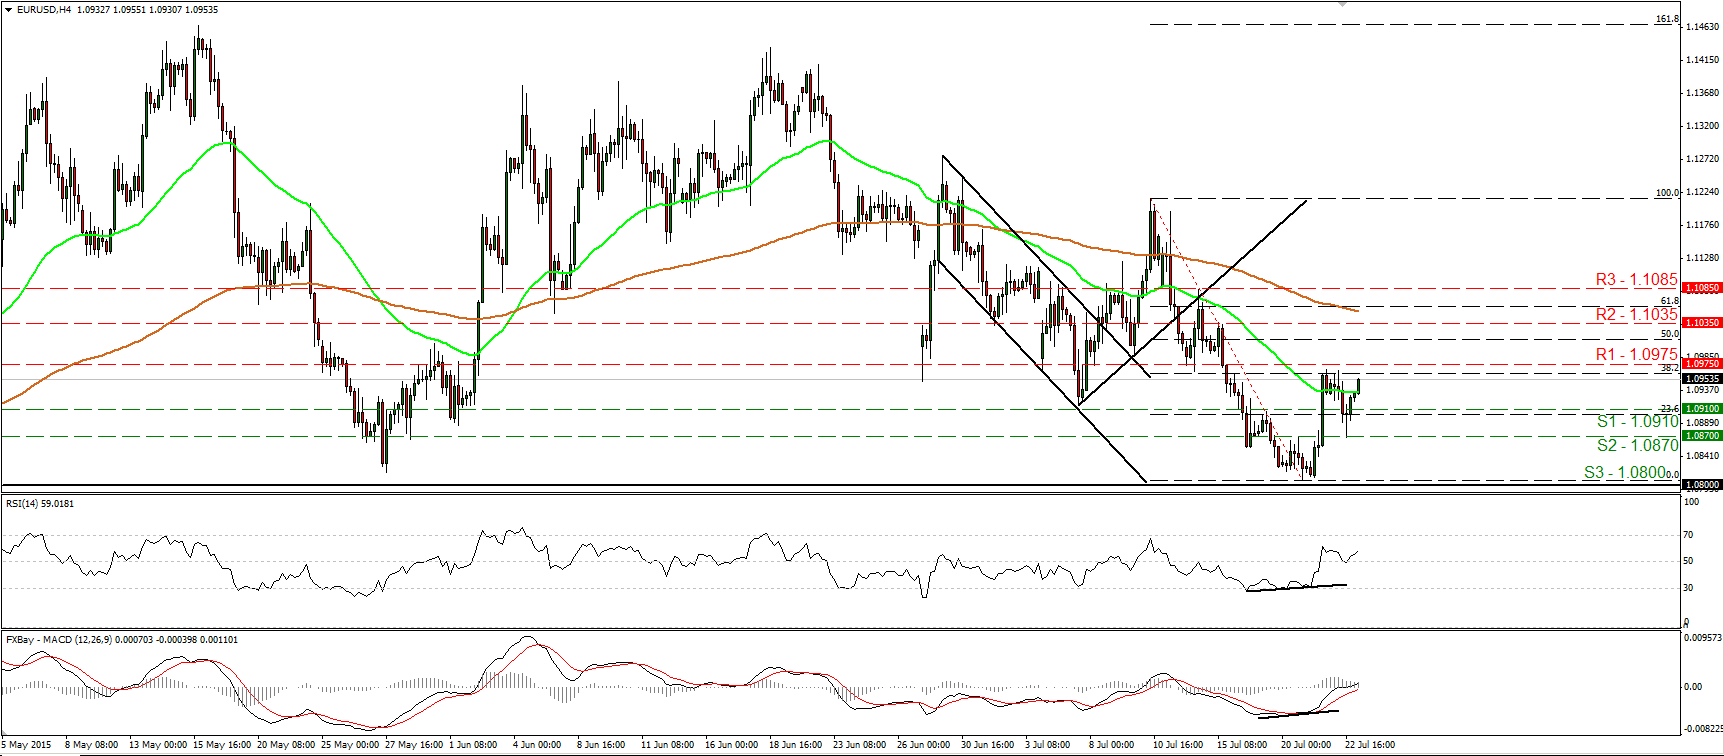
EUR/USD hits support at 1.0870 and rebounds
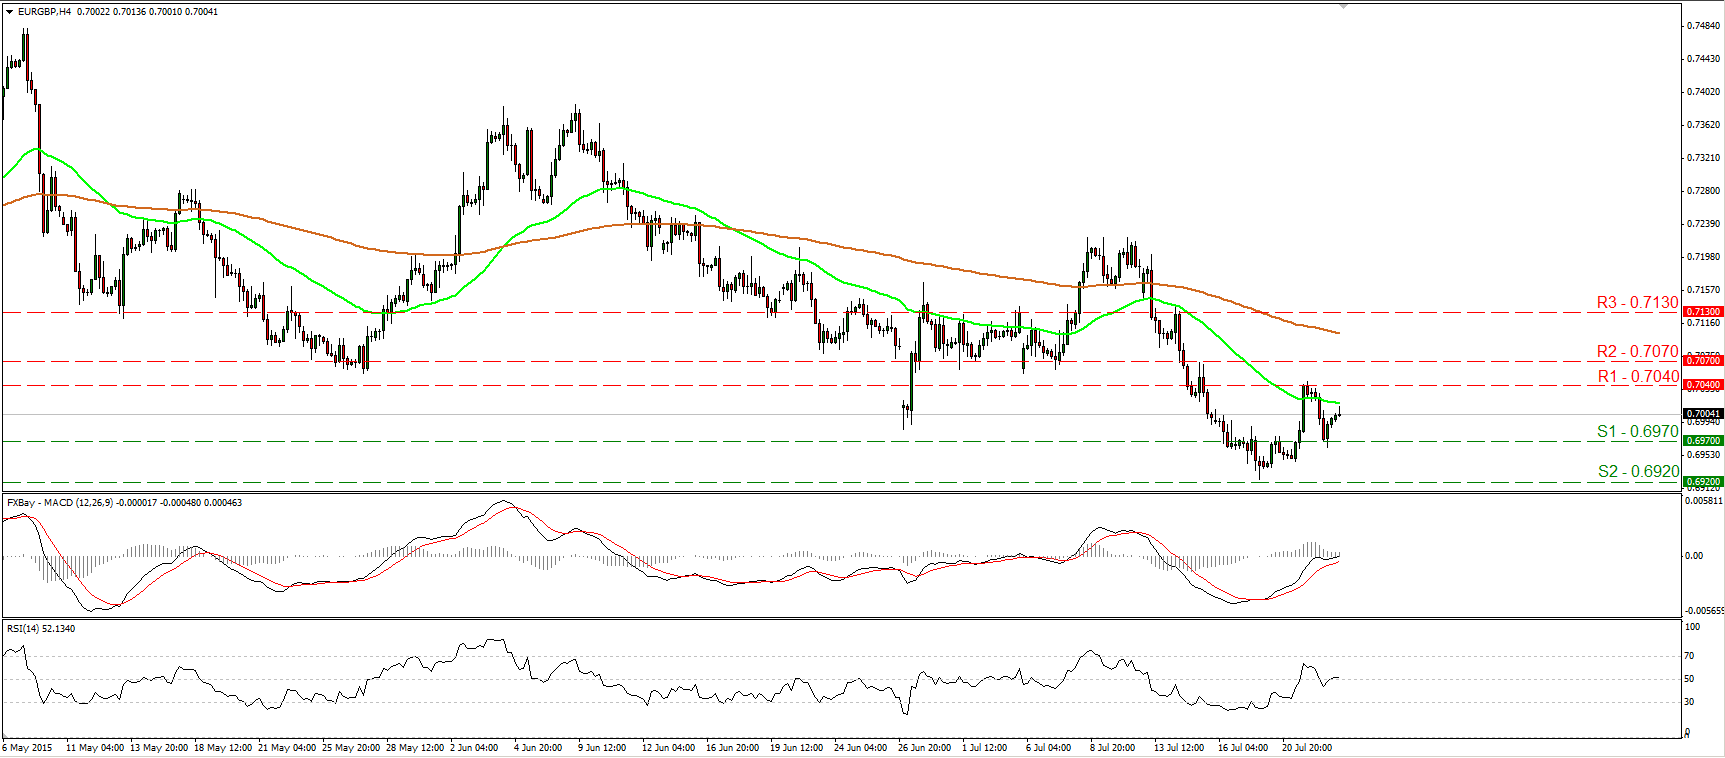
EUR/GBP rebounds from near 0.6970
• EUR/GBP hit support fractionally below the 0.6970 (S1) barrier and rebounded, printing a higher low on the 4-hour chart. Since the rate is now trading back above the psychological zone of 0.7000, I would switch my stance to neutral. A move above 0.7040 (R1) is needed to confirm a forthcoming higher high and perhaps turn the short-term outlook positive. Our momentum indicators support that the pair could trade higher for a while, at least for another test at 0.7040 (R1). The RSI is back above its 50 line, while the MACD has just poked its nose above its zero line. As for the broader trend, although the rate is back above 0.7000, the price structure on the daily chart remains lower peaks and lower troughs. Therefore, I still believe that the overall path of this pair is to the downside.
• Support: 0.6970 (S1), 0.6920 (S2), 0.6900 (S3)
• Resistance: 0.7040 (R1), 0.7070 (R2), 0.7130 (R3)
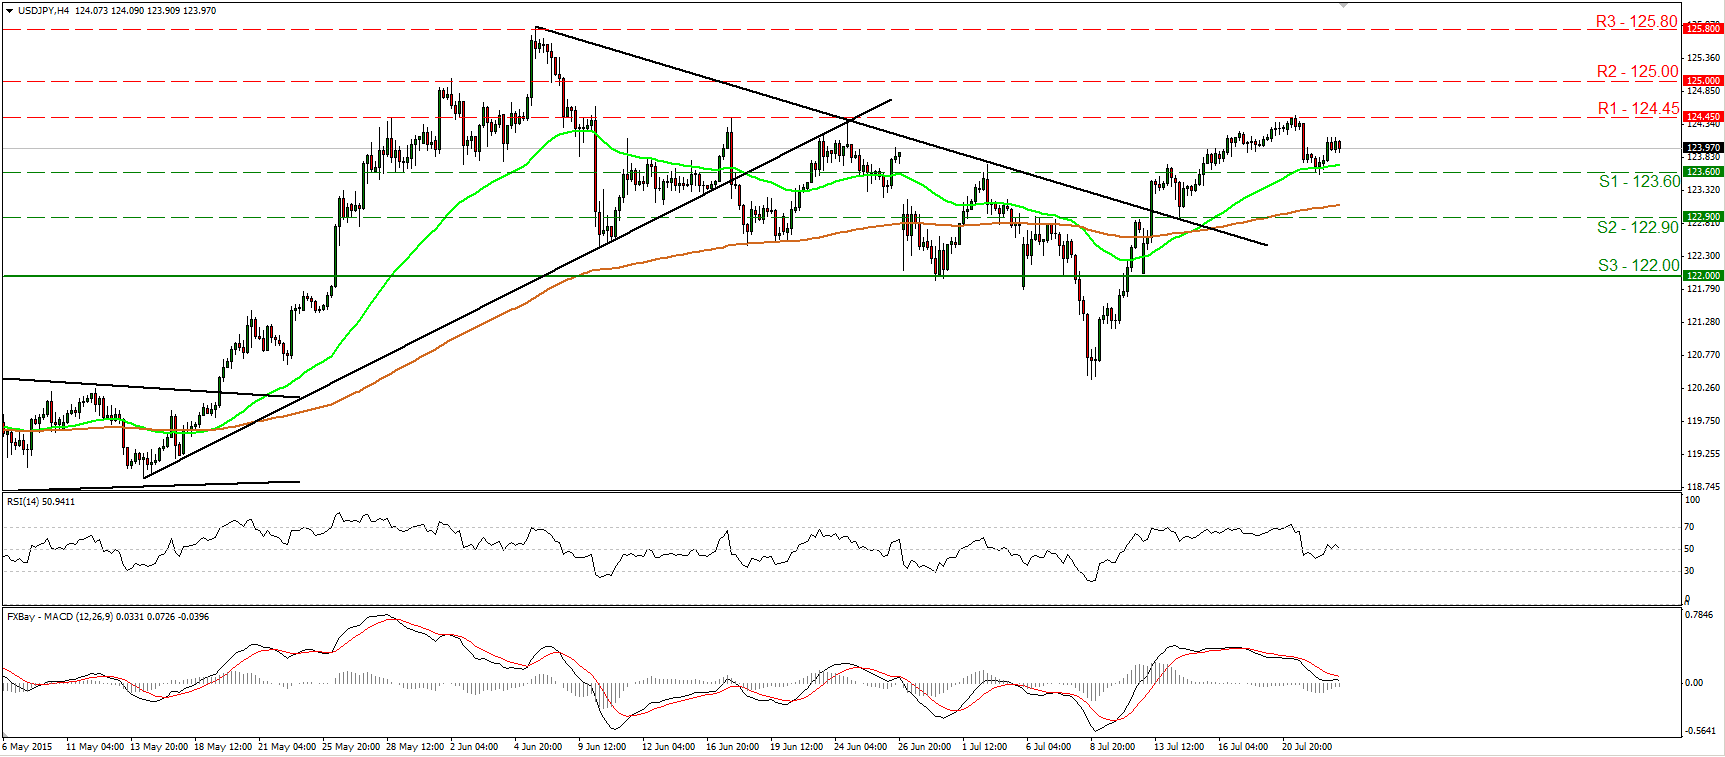
USD/JPY rebounds from 123.60
• USD/JPY traded slightly higher on Wednesday after it hit support at 123.60 (S1). However, the rate stayed between that barrier and the resistance of 124.45 (R1). I maintain the view that the pair could correct lower in the near future. A clear move below 123.60 (S1) is likely to reaffirm the case and perhaps open the way for our next support at 122.90 (S2). Our momentum studies support the notion somewhat. The RSI looks able to move back below its 50 line, while the MACD, although positive, stands below its signal line and could turn negative any time soon. As for the broader trend, I still believe that the move above the downtrend line taken from the peak of the 5th of June is a sign that the longer-term uptrend is gearing up again. Therefore, I would expect any possible further setbacks to provide renewed buying opportunities.
• Support: 123.60 (S1), 122.90 (S2), 122.00 (S3)
• Resistance: 124.45 (R1), 125.00 (R2), 125.80 (R3)
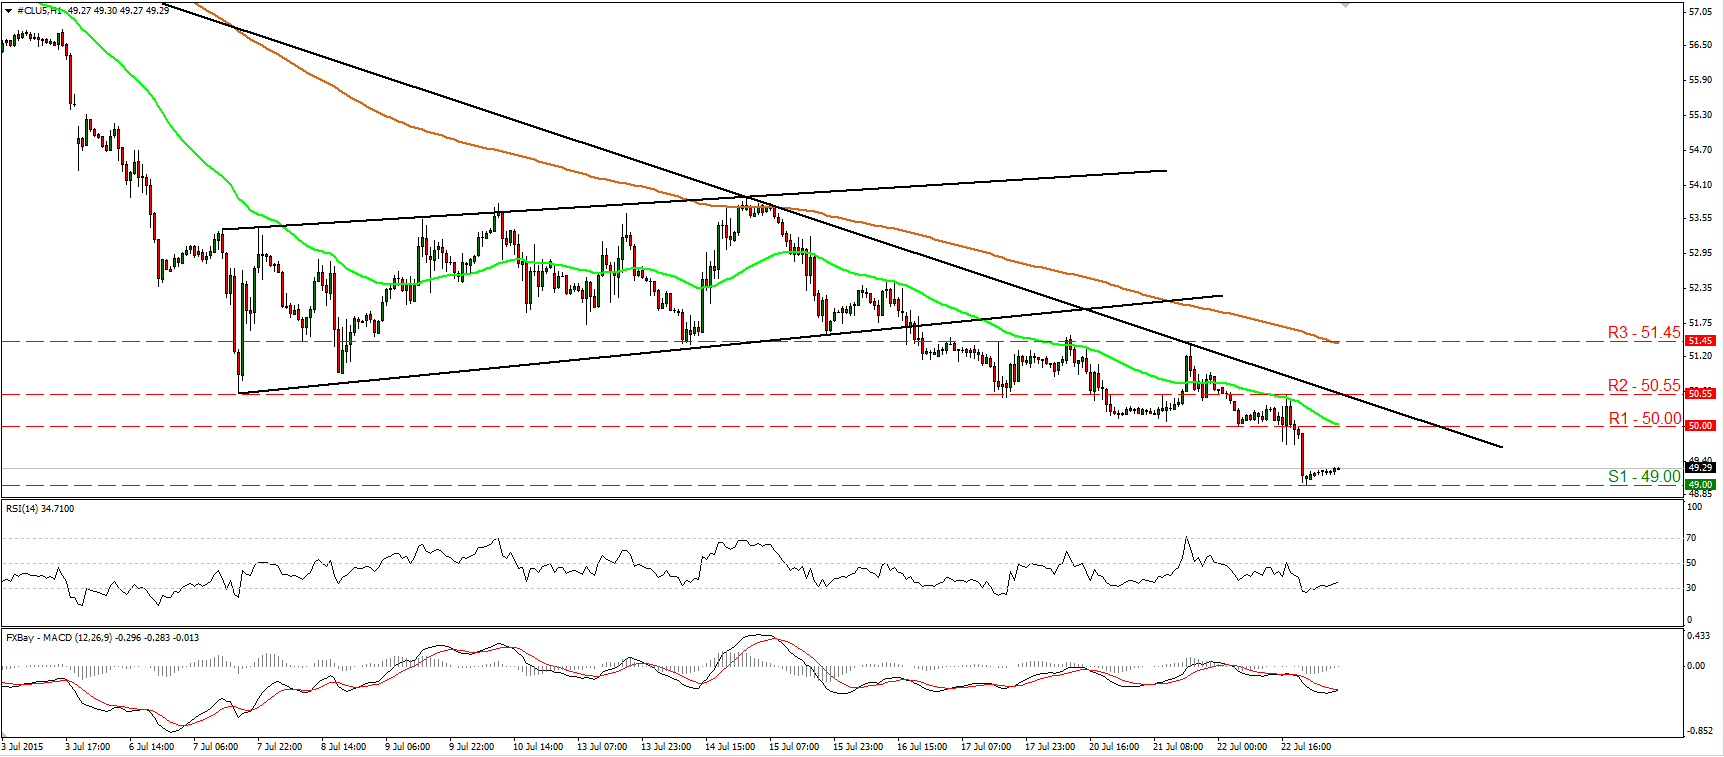
WTI hits support at 49.00
• WTI plunged yesterday, fell below the round figure of 50.00 (R1), and found support at 49.00 (S1). Then it rebounded somewhat. In my view, the short-term trend is still negative, and I would expect a clear move below 49.00 (S1) to open the way for the 48.00 (S2) territory, defined by the low of the 2nd of April. Nevertheless, our short-term oscillators give evidence that a corrective bounce could be looming first, perhaps to challenge the 50.00 (R1) zone as a resistance this time. The RSI edged higher after it rebounded from slightly below its 30 line, while the MACD has bottomed and could move above its trigger line soon. On the daily chart, I see that the medium-term trend is negative as well. Moreover, our daily oscillators detect strong downside speed and magnify the case for further declines. The 14-day RSI fell again below 30, while the daily MACD stands below both its zero and signal lines, and points south.
• Support: 49.00 (S1), 48.00 (S2), 47.00 (S3)
• Resistance: 50.00 (R1), 50.55 (R2), 51.45 (R3)
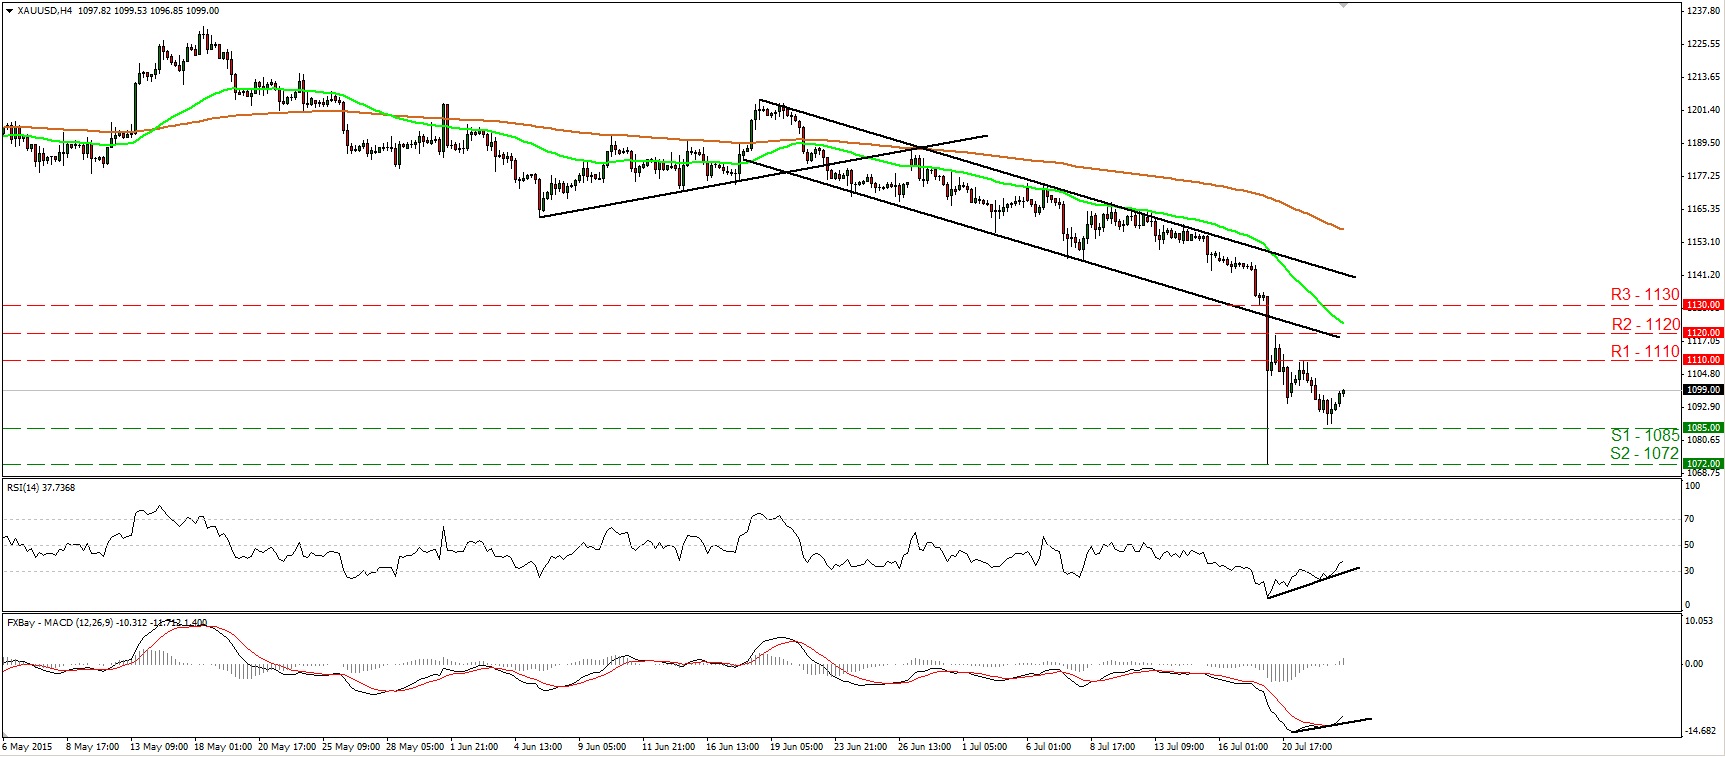
Gold rebounds from fractionally above 1085
• Gold traded somewhat lower on Wednesday, hit support fractionally above the 1085 (S1) line, and then rebounded. As long as the metal is trading below the lower line of the short-term downside channel that had been containing the price action from the 18th of June until yesterday, I would consider the short-term outlook to remain negative. However, taking a look at our short-term momentum studies, I would expect the upside corrective move to continue and perhaps challenge once again the 1110 (R1) resistance obstacle. The RSI exited its below-30 zone and could be headed towards its 50 line now, while the MACD has bottomed and crossed above its trigger line. Furthermore, there is positive divergence between both these indicators and the price action. In the bigger picture, Monday’s plunge triggered the continuation of the longer-term downtrend and kept the overall bias of the yellow metal to the downside.
• Support: 1085 (S1), 1072 (S2), 1060 (S3)
• Resistance: 1110 (R1), 1120 (R2), 1130 (R3)

