•Dr. Johnson was right Dr. Samuel Johnson, he of the 18th century English dictionary, once said, “when a man knows he is to be hanged in a fortnight, it concentrates his mind wonderfully.” Apparently, that worked with Greece too. With only days before his country would have to default and perhaps leave the Eurozone, Greek PM Tsipras presented a new set of proposals to the creditors that went a long way towards meeting their demands. In particular, the new proposals meet much of the requirements with regards to the government’s primary surplus targets and pension reform.
•Greece is not out of the woods yet, however. First off, the proposals do not meet all of the requirements — for example, for spending cuts and tax increases (sales taxes appear to be one of the major points of disagreement remaining). IMF chief Lagarde said the proposal “still lacks specificity” and that an “enormous” amount of work still lies ahead. Moreover, Tsipras is still insisting that creditors must reduce Greece’s debt burden, but Germany and some other countries are still reluctant to do so, although both German Chancellor Merkel and French President Hollande both agree that the issue has to be dealt with eventually – probably after this agreement is signed. Finally, the Greek parliament will have to pass any agreement before it can even be submitted to the German Bundestag for its approval, but some members of Tsipras’ ruling SYRIZA coalition remain opposed to making the necessary concessions. In other words, the negotiators now have the basis for further work, rather than the finished deal.
•European leaders gave Tsipras 48 hours to come up with something that they could sign off on at the EU leaders’ summit scheduled for Thursday. That then becomes the deadline. So staff level discussions will continue, followed by approval from the Eurogroup of finance ministers Thursday and then the EU leaders at their summit, assuming everything goes OK. The assumption is that the EU leaders would start discussion on longer-term debt relief after the measures were agreed on. Both the Greek and German parliaments have to pass the proposals and the money has to be released in time for Greece to repay the IMF next Tuesday. This will be quite tight, as the Bundestag begins its summer holiday on Monday. I’m not sure whether they can meet on the weekend.
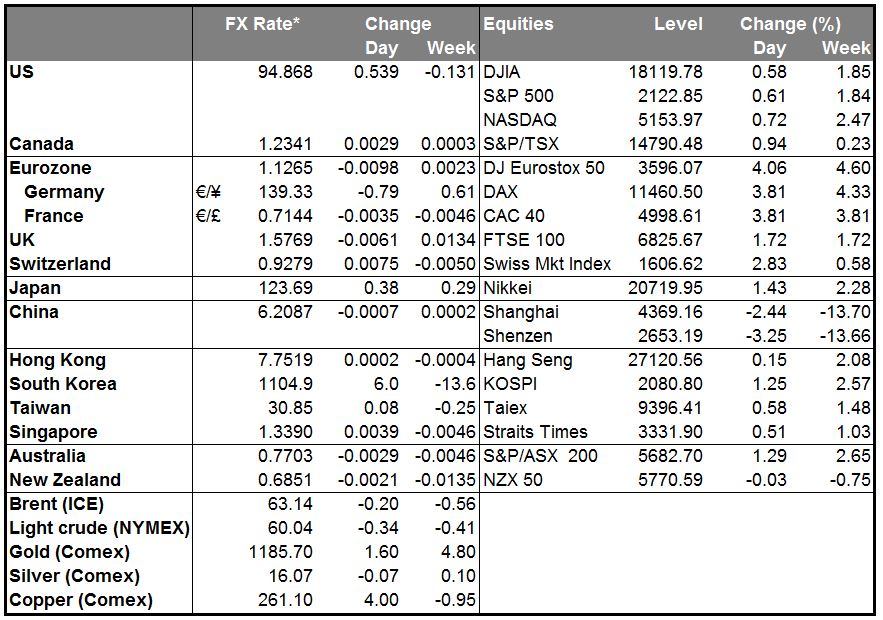
•EUR assets rally on the news, but EUR itself weakens The Euro Stoxx 50 index rose 4.1% yesterday, with Greek stocks up 9%. Meanwhile, spreads over Germany of 10-year Italian bonds, which the market is using as a proxy for illiquid Greek bonds, narrowed by around 26 bps to 127 bps. This shows that the market is assuming a successful conclusion to the talks. So why is EUR/USD about 1% lower this morning than it was 24 hours ago? There are two possible explanations: 1) the euro is trading as a funding currency, not an asset, and 2) investors are hedging the currency risk on their euro-denominated investments. The first would indicate that in a risk-on situation, investors would be borrowing euros and using them to invest in other assets, while the second would suggest that as investors pile into European stocks and bonds, they simultaneously sell forward their euro exposure to hedge their position. By this understanding, we can see that the successful resolution to the Greek issue does not guarantee a stronger euro, while the failure of the talks and a Greek crisis almost assuredly would mean a weaker euro.
•In any case, the euro’s performance yesterday was consistent with the overall performance of the dollar, which gained as US existing home sales rose to the highest level since 2007 (if we exclude a period when they were boosted temporarily by a special tax credit). Both Fed funds rate expectations and US bond yields moved higher, with UST 10-year yields up a significant 11 bps on the day, in contrast to the decline in peripheral European yields. Given the dollar’s recent good performance and the large cutback in short currency/long USD positions shown in Friday’s Commitment of Traders report, further gains seem possible as the momentum continues. Today’s data is likely to boost the dollar further, in my view (see below).
•Today is PMI day Tuesday is a PMI day. During the Asian day, China’s preliminary HSBC manufacturing PMI rose to 49.6 from 49.2 last month. While this beat the market’s estimate of 49.4, it was still below the crucial 50 line that divides expansion from contraction. The improvement shows the economy stabilizing at best. Nonetheless, Chinese stocks continued to fall as margin calls continue to hit investors. AUD and NZD both weakened more than CAD, the other commodity currency.
• During the European day, we get the preliminary manufacturing and service-sector PMI data for June from several European countries and the Eurozone as a whole. The expectations are for the manufacturing PMIs to remain unchanged or increase a bit, while service-sector PMIs are likely to decline somewhat. Even though the main theme this week is Greece, a strong positive surprise from the PMIs would be needed for the EUR to strengthen somewhat.
•We have a busy day in the US with data that is forecast to be largely USD-positive. The Markit PMI is expected to show manufacturing expanding at an accelerating pace, which should be USD-positive. The headline figure for durable goods orders for May is expected to fall at a faster pace than in April, but durable goods orders excluding transportation equipment are estimated to have risen, a turnaround from the previous month. The focus is usually on the core figure, where a positive surprise could suggest the possible start of a turnaround in business investment that would be bullish for the dollar. New home sales for May and FHFA housing price index for April are also due out. The forecast of an increase in new home sales could add to the recent strong housing data and strengthen USD. Richmond Fed manufacturing activity index for June is also coming out.
•As for the speakers, Norges Bank Governor Oeystein Olsen and Fed Governor Jerome Powell speak.
The Market
EUR/USD falls below 1.1300
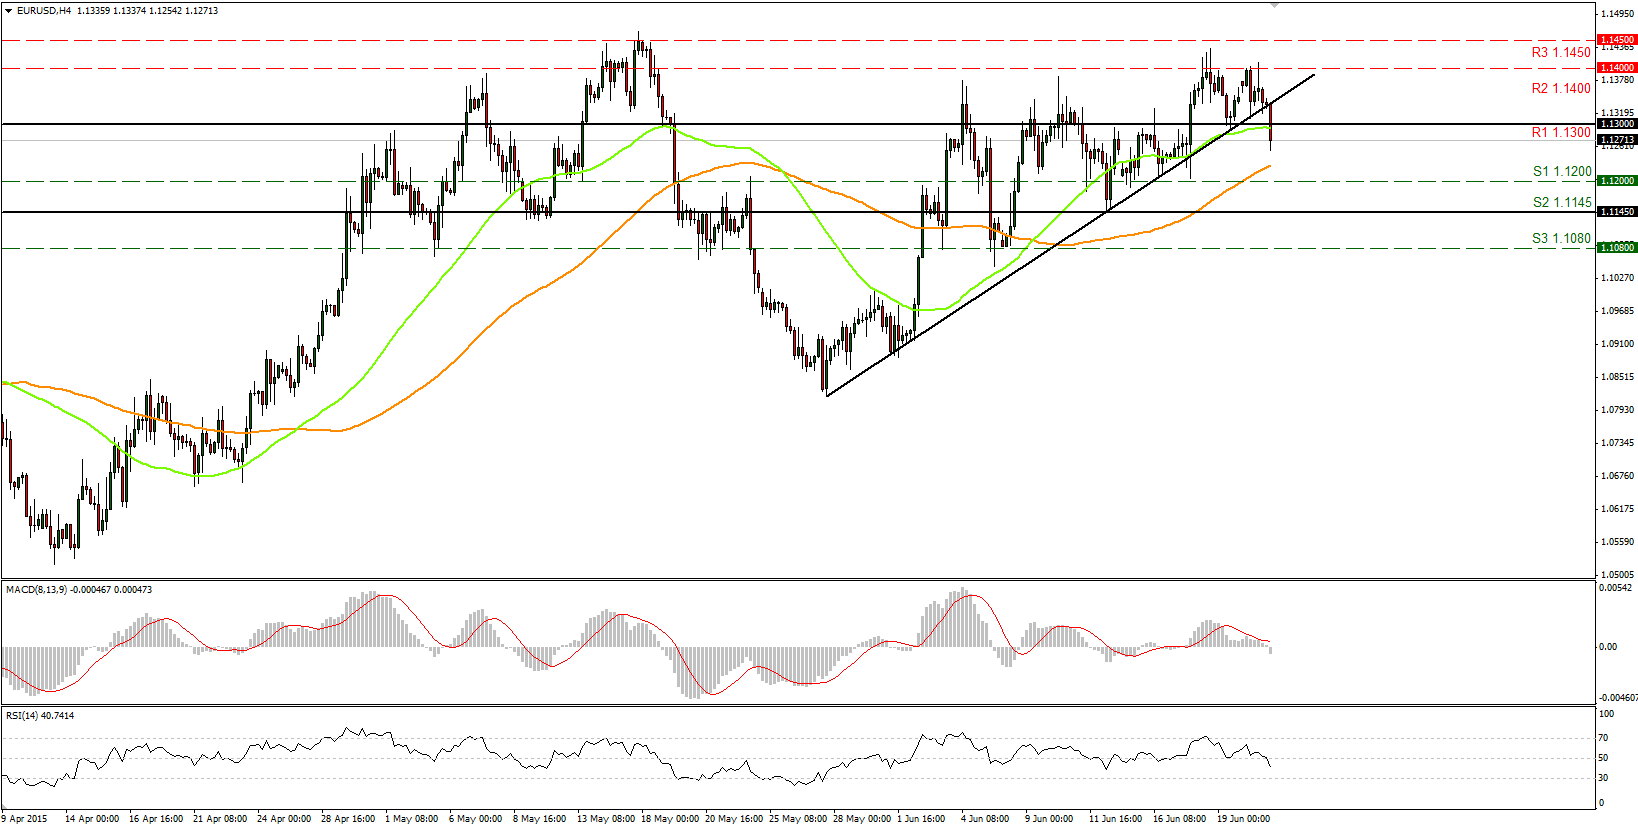
• EUR/USD fell during early European morning Tuesday, breaking below our support-turned-into-resistance line of 1.1300 (R1). If the bears prove strong enough and keep the rate below that area, we could see further declines, perhaps towards the 1.1200 (S1) support zone. A break below that level is likely to target our next support of 1.1145 (S2). Our short-term momentum studies support this notion. The RSI fell below the 50 line and points down, while the MACD failed to break above its trigger line, turned down and dipped into its negative territory.
• As for the broader trend, I would like to remain neutral and wait for a break below the 1.1080 (S3) area to carry larger bearish implications.
• Support: 1.1200 (S1), 1.1145 (S2), 1.1080 (S3)
Resistance: 1.1300 (R1), 1.1400 (R2),1.1450 (R3)
GBP/USD is testing again the black uptrend line as a support
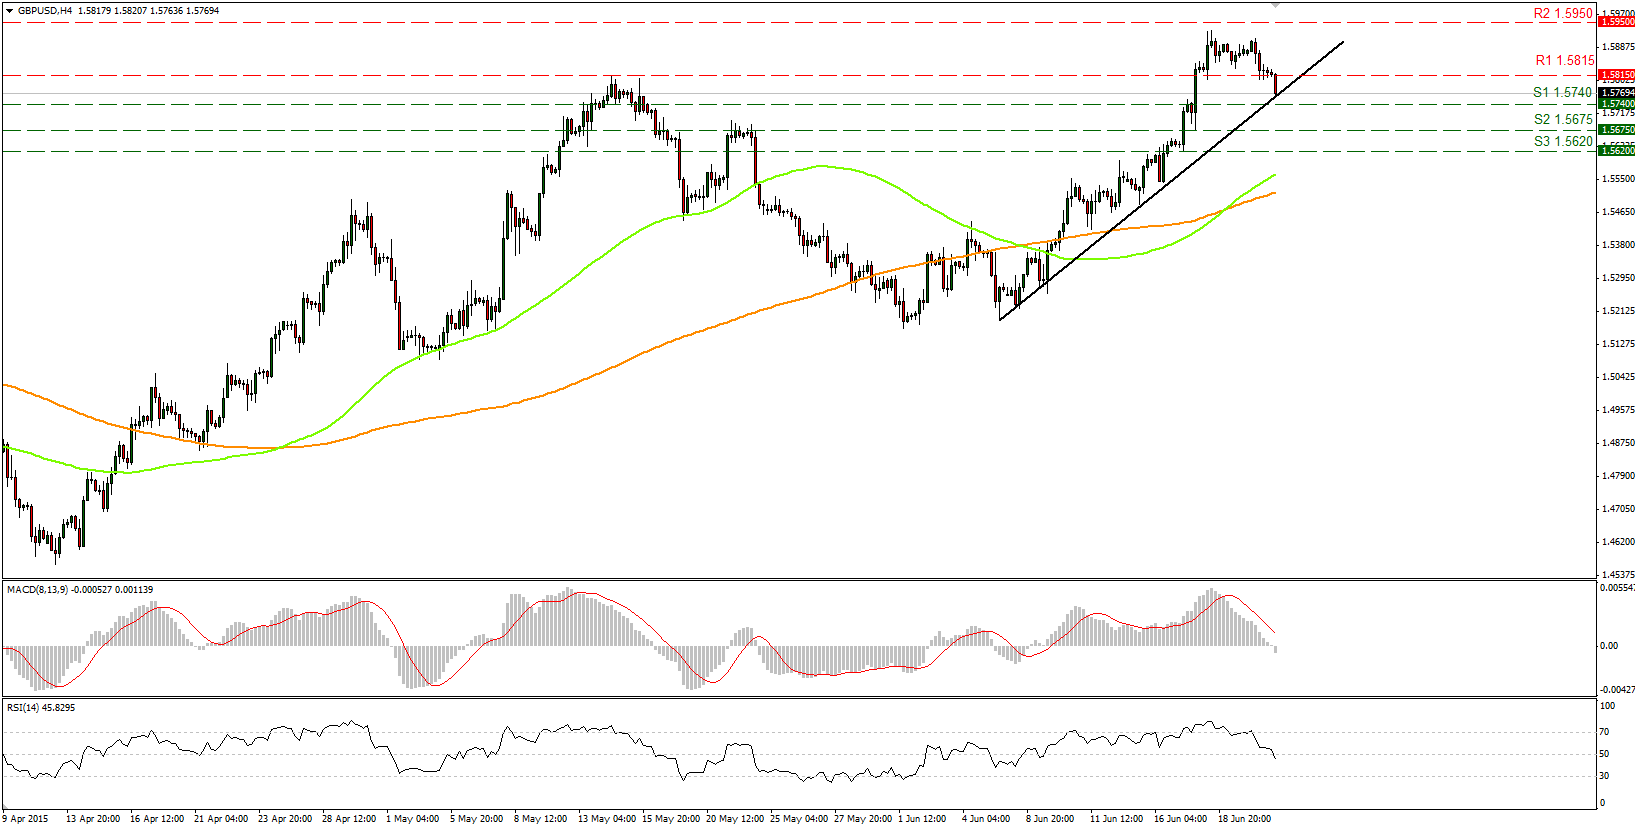
•GBP/USD declined on Monday after finding resistance near 1.5950 (R1). During the early European Tuesday, the pair continue trading lower, testing again the black uptrend line as a support. A break below that uptrend line, and subsequently the 1.5740 (S1) support zone, could trigger further declines, perhaps towards our next support of 1.5675 (S2). Our short-term oscillators support further declines. The RSI fell below 50 and is pointing down, while the MACD, already below its trigger line, fell below zero. However, switching to the daily chart, I see that after rebounding from the 50% retracement level of the 14th of April - 15th of May up leg, GBP/USD moved back above the 80-day exponential moving average. In my view, the move above 1.5800 on the 17th of June confirmed that the overall picture has turned positive.
• Support: 1.5740 (S1), 1.5675 (S2), 1.5620 (S3)
• Resistance: 1.5815 (R1) 1.5950 (R2), 1.6000 (R3)
USD/JPY just below 123.80
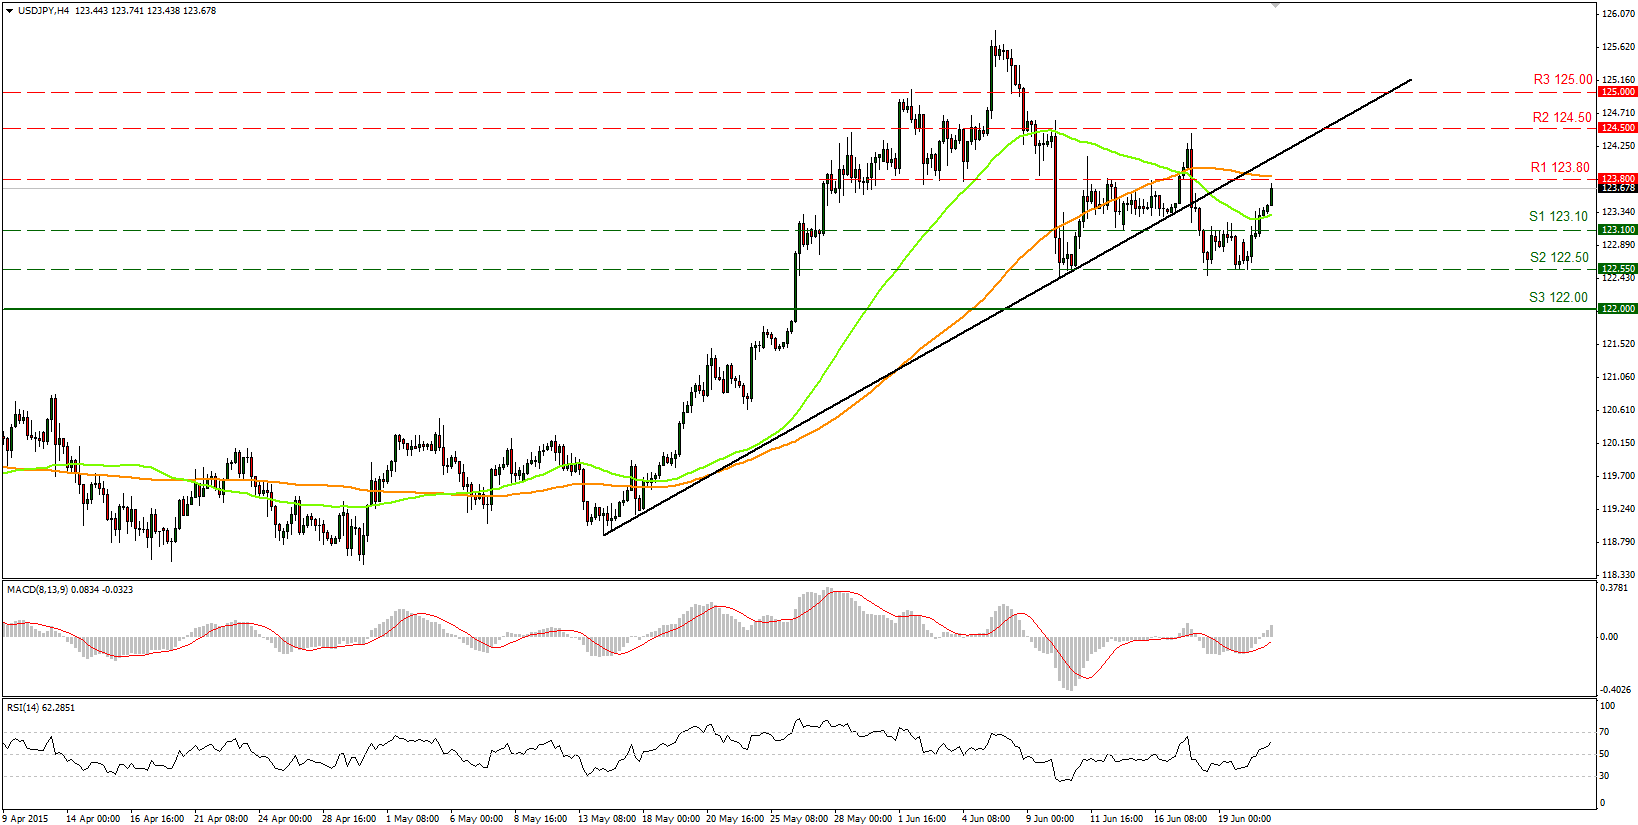
• USD/JPY surged during the Asian session Tuesday, but the move was halted a touch below our resistance line of 123.80 (R1). A break of that line could target initially the black uptrend line to test it as a resistance this time, and if the bulls prove strong enough, the rate could move higher towards 124.50 (R2). The move higher confirmed the positive divergence between our short-term oscillators and the price action. Therefore, we could see further advances in the not-too-distant future. The RSI break above the 50 line and moves towards the 70 area, while the MACD lies above its zero and trigger lines. These momentum signs support further advances. In the bigger picture, the break above the 122.00 (S3) zone on the 26th of May triggered the continuation of the long-term upside path. I would treat any further near-term declines as a corrective phase of the larger uptrend.
• Support: 123.10 (S1), 122.50 (S2), 122.00 (S3)
• Resistance: 123.80 (R1), 124.50 (R2), 125.00 (R3)
DAX finds resistance near 11500
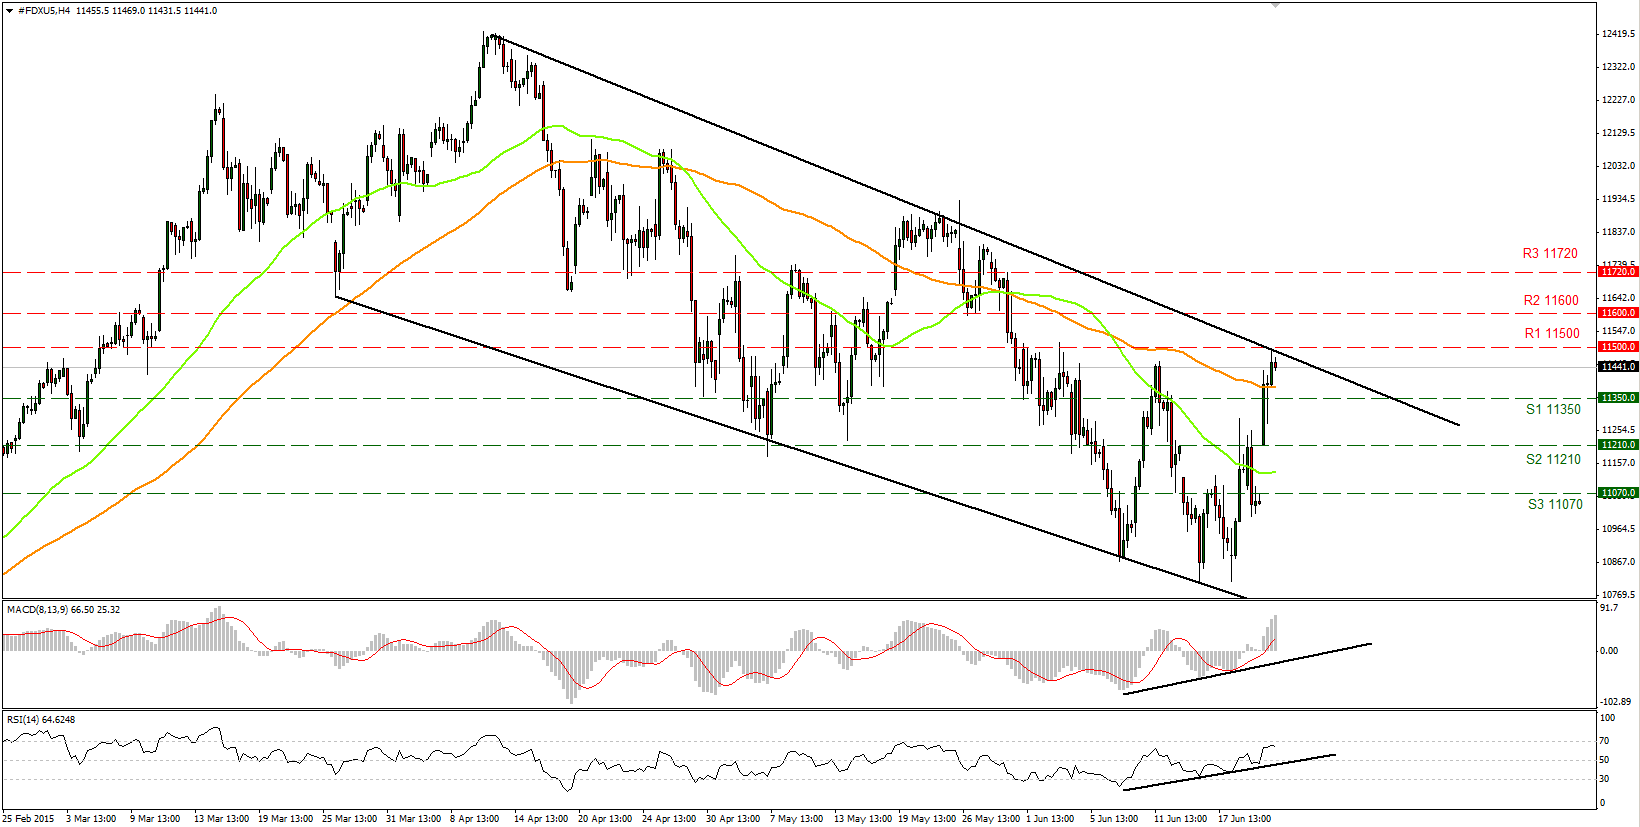
• DAX futures surged on Monday, but found resistance close to the crossroad of the 11500 (R1) hurdle and the upper boundary of the downslope channel. A break of that area is needed to support further advances. Our short-term oscillators reveal upside speed and amplify the case that DAX could trade higher in the near future. The RSI found support at its 50 line and moved higher, while the MACD stands above its trigger and zero line. In the bigger picture, although the index is trading within a downside channel and below the uptrend line taken from the low of the 16th of October, I would switch my view to neutral and wait for a break above the 11500 (R1) to trust further advances.
• Support: 11350 (S1), 11210 (S2), 11070 (S3)
• Resistance: 11500 (R1) 11600 (R2), 11720 (R3)
WTI in a sideways path
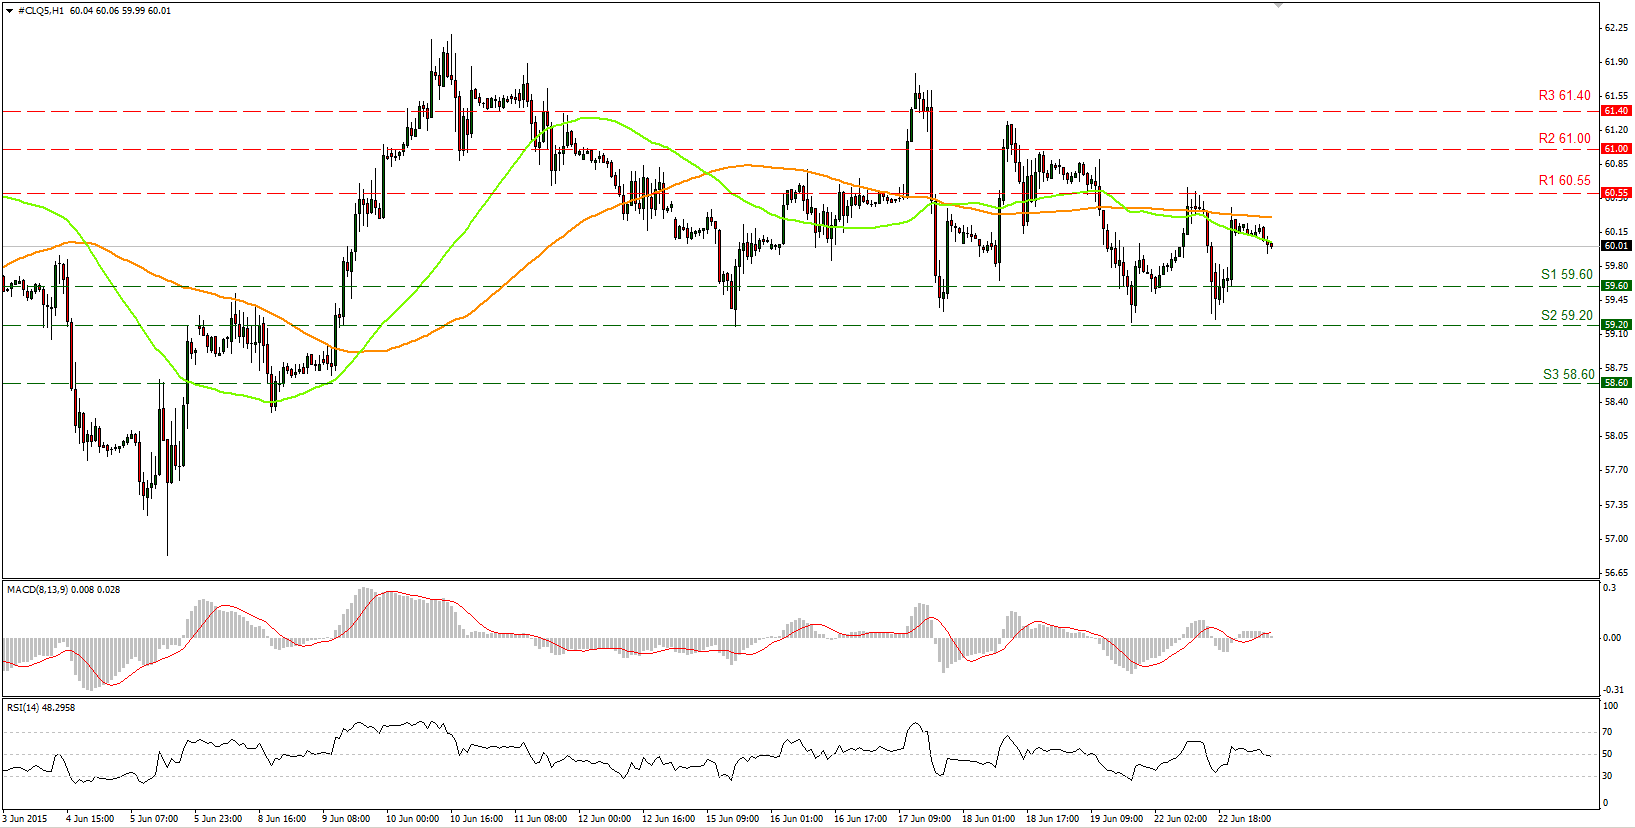
• WTI trades in a consolidative manner between the 60.55 (R1) resistance line and the 59.60 (S1) support area. A break in either direction is needed to determine the near-term bias. Therefore, I would consider the intraday bias to remain neutral. Our technical studies support the trendless short-term picture as well. The RSI lies near its 50 line and points sideways, while the MACD, although positive, points east as well. As for the broader trend, the break above 55.00 on the 14th of April signaled the completion of a double bottom formation, something that could carry larger bullish implications in the not-too-distant future. However, WTI has been trading in a sideways mode since the 6th of May, and this is supported by our daily oscillators as well. Both the 14-day RSI and the daily MACD lie near their equilibrium lines and point sideways.
• Support: 59.60 (S1), 59.20 (S2), 58.60 (S3)
• Resistance: 60.55 (R1), 61.00 (R2), 61.40 (R3)

