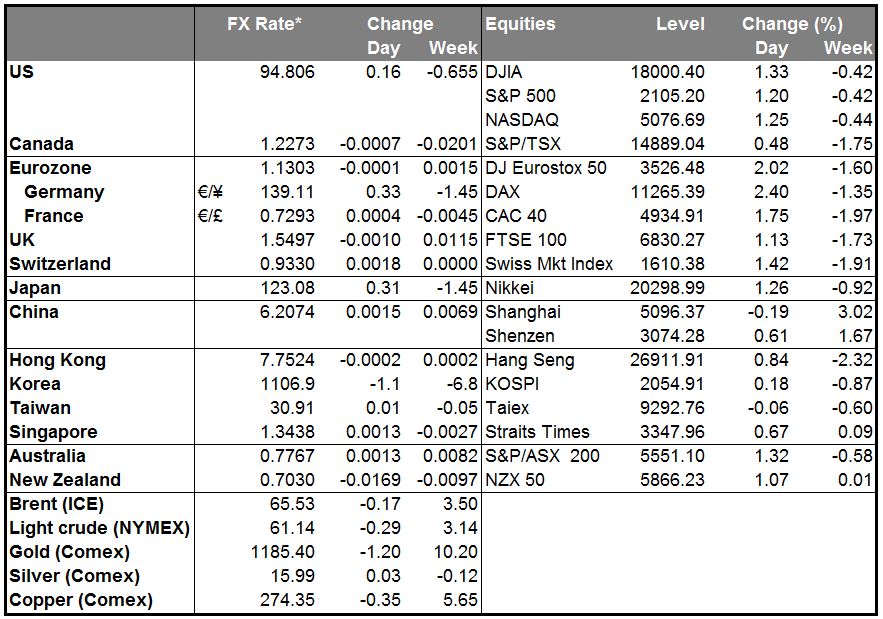
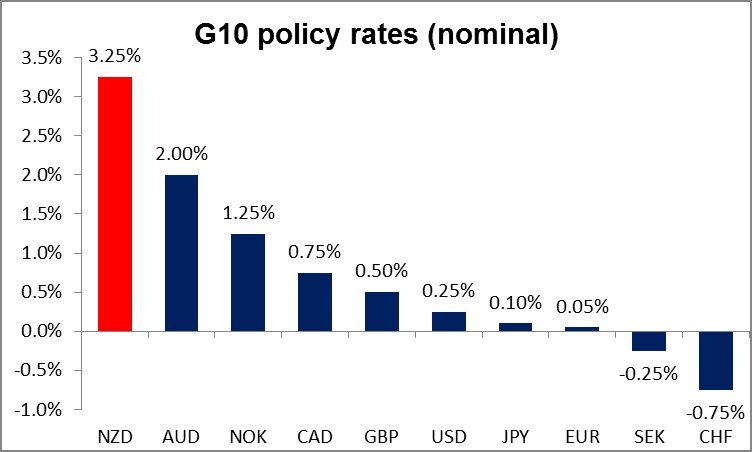
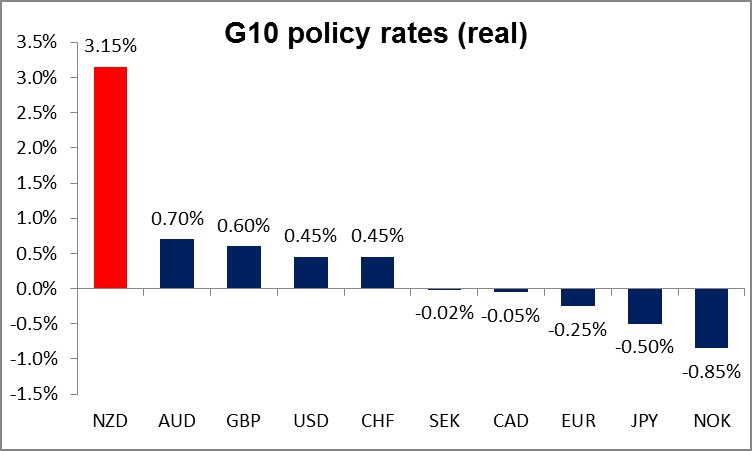
Currency wars return as RBNZ cuts rates, declares easing cycle The Reserve Bank of New Zealand (RBNZ) not only cut rates by 25 bps, as the market largely expected (61% probability), but also announced an easing bias. The last paragraph of the statement said, “We expect further easing may be appropriate. This will depend on the emerging data.” This was a more definite statement of intention than in the 30 April statement, when it said the Bank “…is not currently considering any increase in interest rates…It would be appropriate to lower the OCR if demand weakens, and wage and price-setting outcomes settle at levels lower than is consistent with the inflation target.” One of the key points about New Zealand is that it remains one of the few G10 countries that can still lower interest rates – at 3.25%, the cash rate is still far above the next highest country, Australia (2.0%) -- so there is plenty of room for the market to revise down its estimates. New Zealand’s key rate is even more of a standout on a real basis. And just in case anyone in the FX market didn’t get the message, the Bank also said the NZD “remains overvalued. A further significant downward adjustment is justified.” It’s no surprise then that NZD was the worst-performing G10 currency overnight. I would expect it to remain weak for some time until the market has fully digested the likelihood of further easing in New Zealand.
South Korea also cuts rate South Korea also cut its key rate to a record low 1.5% as overseas demand weakens – export volumes have fallen for five months in a row -- and Middle East Respiratory syndrome (MERS) threatens to derail domestic demand. One reason for the weak export performance is the won’s strength vs both JPY and EUR. Considering today’s moves by both New Zealand and South Korea, it looks to me like we are back in the currency wars. That’s another reason why I expect JPY to weaken further, despite what Gov. Kuroda said yesterday (see below).
Australian unemployment AUD, on the other hand, was the best-performing G10 currency overnight, as the unemployment rate unexpectedly declined and the number of people in work rose sharply. The figure came as a big surprise, as other indicators of Australia’s economy are not particularly strong. The market is not expecting any more interest rate cuts this year, despite what Gov. Stevens says. That’s likely to support AUD going forward, at least until some new statistics come out to change peoples’ views.
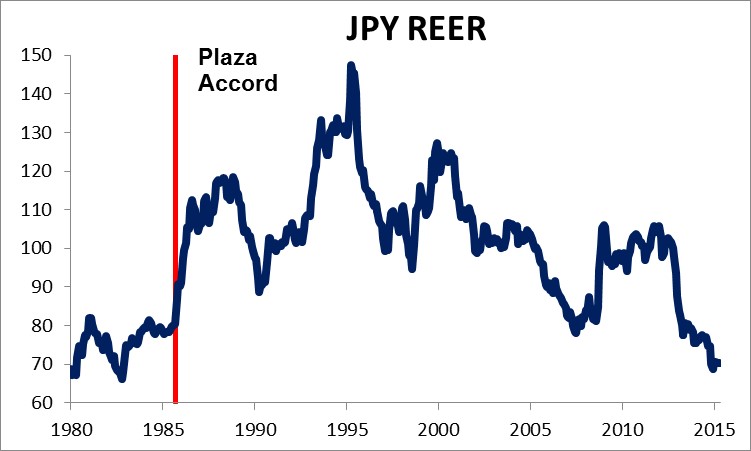
Kuroda is clearly right about JPY REER, but not necessarily about its prospects Bank of Japan Gov. Kuroda yesterday noted that the yen’s real effective exchange rate (REER) was back to where it was before the Lehman Bros. collapse. Actually, he could’ve gone much, much further. A longer data series by the IMF shows that JPY’s REER is below where it was before the Plaza Accord, the Sept. 1985 agreement to boost the value of the yen. The question is though, what difference does it make nowadays? In the old Plaza/Louvre Accord days, it was the current account – in other words, trade – that determined the path of a currency. In those days, when a currency got too cheap, imports would fall and exports would rise, the trade surplus would rise, and the cheap currency would self-correct. But now with financial flows dominating, this doesn’t necessarily happen. A weak currency can be a symptom of imbalances in the financial system that only encourage further outflows (e.g., where do you think the Greek drachma would be trading at right now if it still existed?) Thus, while it’s clear the yen is historically weak, that doesn’t mean it can’t get weaker.
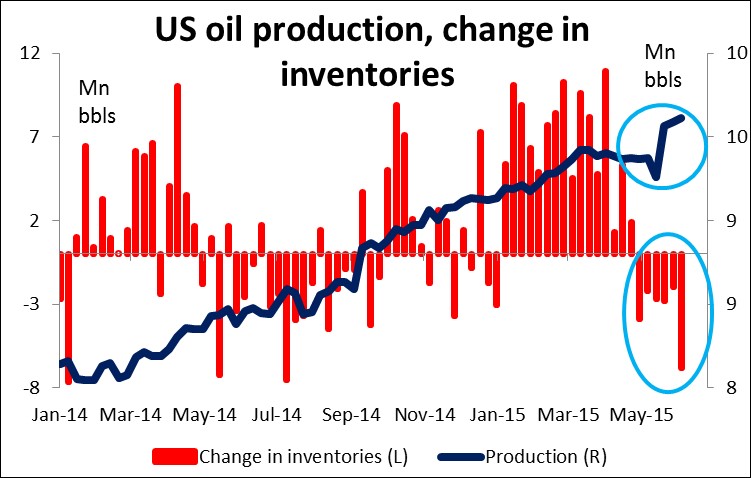
US oil inventories plunge even as output rises further Oil continued its rally after the US Energy Information Agency (EIA) data showed a much bigger-than-expected decline in inventories. However, the data did not show any decline in output – on the contrary, US oil output hit what looks to me like a record high (but it’s hard to say because of inconsistent data sources). Inventories at the main US delivery point of Cushing, Oklahoma, which at one point were expected to be full by now, fell for the seventh consecutive week. It seems to me that the market is focusing too much on the inventory situation and not enough on the production. Inventories are indeed falling but production isn’t. In order for prices to come down, we should see the increased OPEC production displacing US production. We haven’t yet. I still believe that oil prices are likely to fall and that CAD and NOK remain vulnerable to such a change. As they say in the oil business, high prices cure high prices.
Not what we need right now Greek PM Tsipras yesterday held another round of talks with his French and German counterparts, but there were no signs that either side had moved closer to achieving a deal. Just in case there wasn’t enough to worry about, the Greek courts ruled that pension cuts that were part of the country’s second bailout in 2012 are unconstitutional. That will only stiffen the government’s resolve to oppose further concessions. Meanwhile, the German magazine Bild reportedly that Germany’s government has rejected a third aid package for Greece. Meanwhile, some observers are arguing that even if the two sides could agree – which seems increasingly impossible – there’s not enough time now for any agreement to be passed through the German and Greek parliaments before the end-June deadline. The Greek problem hasn’t been too much of a factor in financial markets as everyone largely believes that they will find a last-minute compromise. But as that last minute approaches, I would expect the market to start pricing in a risk premium, which would mean a lower EUR/USD.
Chinese data shows economy stabilizing China released its retail sales, industrial production and fixed assets investment for May, showing that the economy has largely stabilized. Retail sales were in line with the previous month’s figure (as expected), industrial production was higher (better than expected), and fixed asset investment slowed down somewhat (as the government wants). The data presents a better picture of the economy than recent inflation and trade numbers, which had suggested stagnation. Nonetheless they had no impact on AUD or NZD.
Today’s highlights: During the European day, we get the French CPI for May.
Sweden’s CPI and CPIF for May are also due to be released. Following the dip of the CPI back to deflation in April, another sign of weakness in prices could prompt the Bank to ease further its monetary policy. The Bank held out the possibility to act even between the ordinary monetary policy meetings, should the need arise. This is likely to keep SEK under pressure.
In the US, retail sales for May are expected to accelerate. April’s retail sales figures were disappointing and consumer confidence index declined, frustrating markets that have been looking for signs that the soft Q1 patch is coming to an end. A positive surprise could ease market concerns and strengthen USD against its peers. Initial jobless claims for the week ended June 6 are also coming out.
The Market
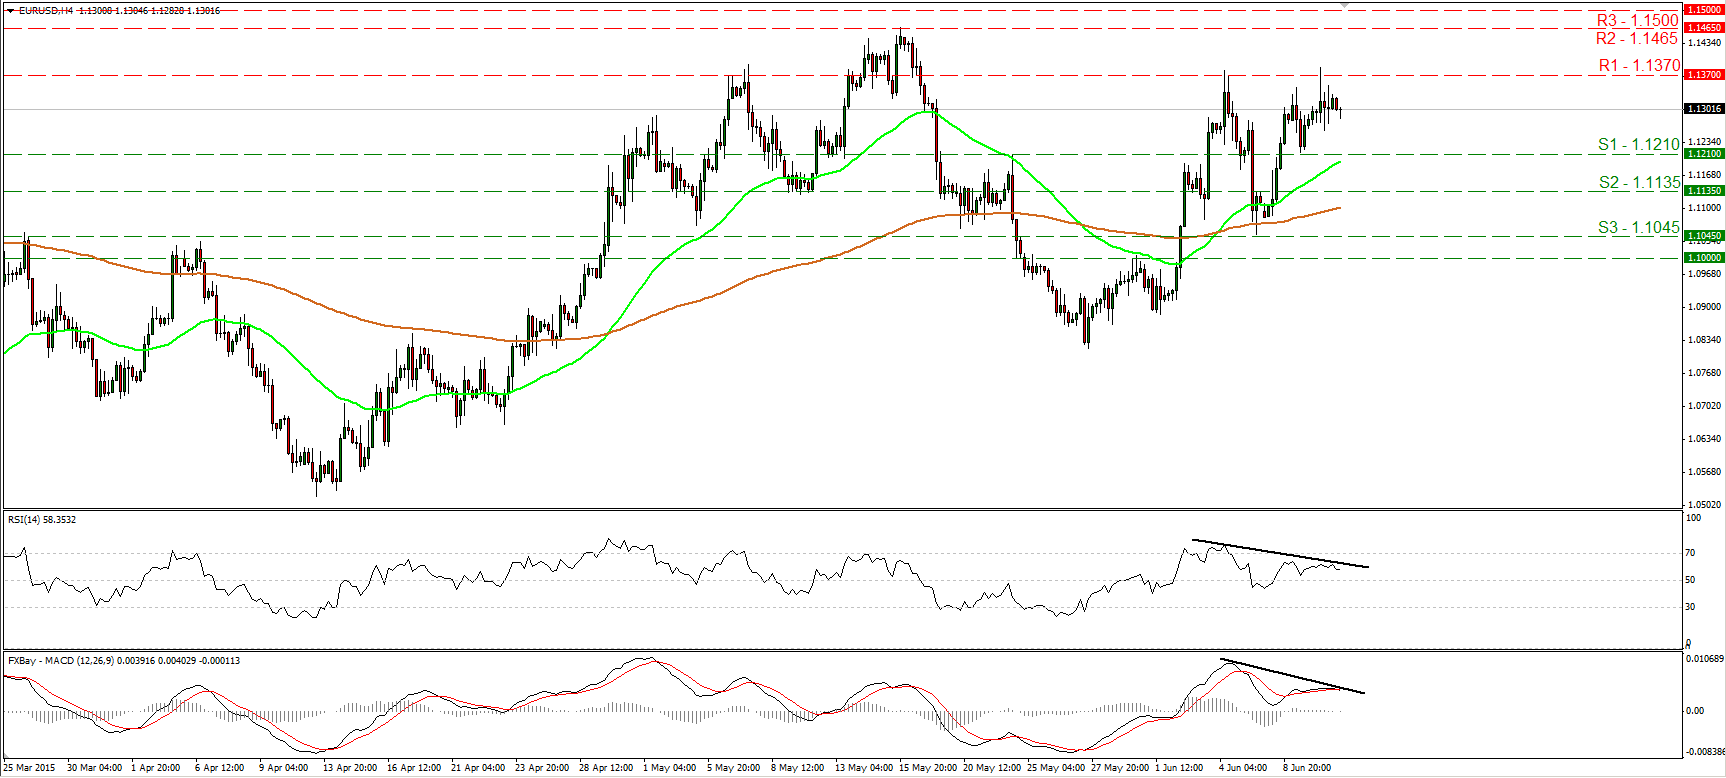
EUR/USD rejected from slightly above 1.1370
EUR/USD traded somewhat higher on Wednesday, hit resistance slightly above 1.1370 (R1) and then retreated. Given that the rate failed to overcome the resistance barrier of 1.1370 (R1), and that there is negative divergence between both our short-term oscillators and the price action, I would hold my neutral stance. A break above 1.1370 (R1) is needed to confirm a forthcoming higher high on the 4-hour chart and perhaps turn the short-term picture to the upside. Such a move could prompt extensions towards our next resistance of 1.1465 (R2). On the downside, a move below 1.1210 (S1), would signal the completion of a minor-term double top formation and perhaps pave the way for our next support at 1.1135 (R2). In the bigger picture, I believe that the move that could carry larger bullish implications is a clear close above the psychological zone of 1.1500 (R3).
• Support: 1.1210 (S1), 1.1135 (S2), 1.1045 (S3).
• Resistance: 1.1370 (R1), 1.1465 (R2), 1.1500 (R3).
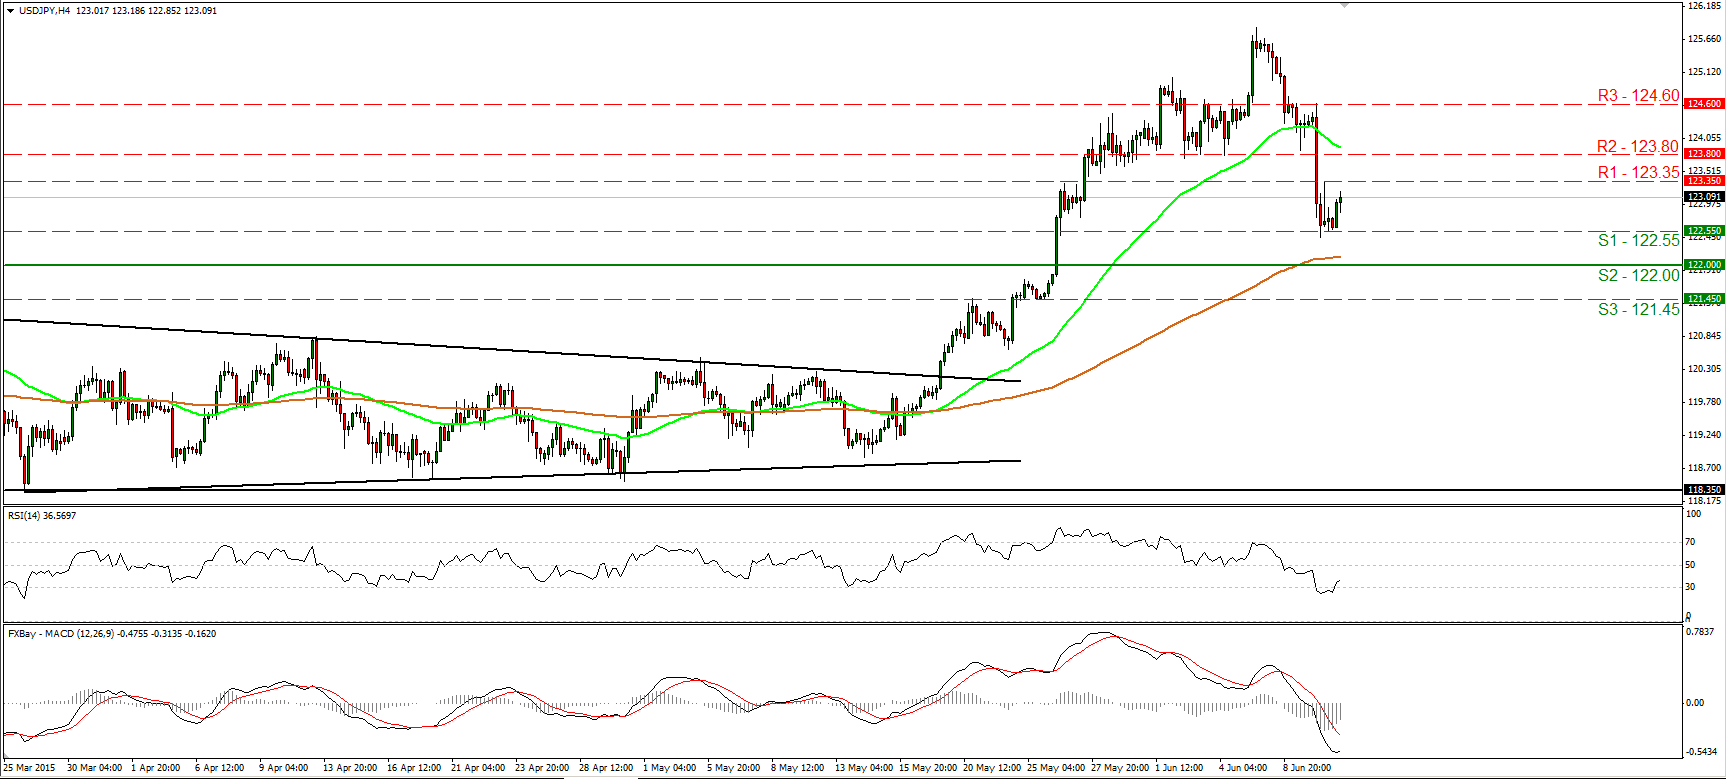
USD/JPY rebounds from near 122.55
USD/JPY rebounded from near 122.55 (S1) yesterday following the plunge during the early European morning. Today, the rate is trading slightly below the 123.35 (R1) resistance line, where an upside break is likely to challenge the next obstacle at 123.80 (R2). Our short-term oscillators support the continuation of the rebound. The RSI exited its oversold conditions, while the MACD has bottomed and could move above its trigger line in the near future. Nevertheless, although we may experience the continuation of the rebound, the likelihood of a lower peak is high. As a result, I would consider the short-term outlook to be cautiously negative. A move below the 122.55 (S1) line is likely to challenge the key zone of 122.00 (S2) as a support this time. In the bigger picture, the break above the 122.00 zone on the 26th of May triggered the continuation of the long-term upside path. Thus, I would see the short-term downtrend as a retracement of the larger uptrend.
• Support: 122.55 (S1), 122.00 (S2), 121.45 (S3).
• Resistance: 123.35 (R1), 123.80 (R2), 124.60 (R3).
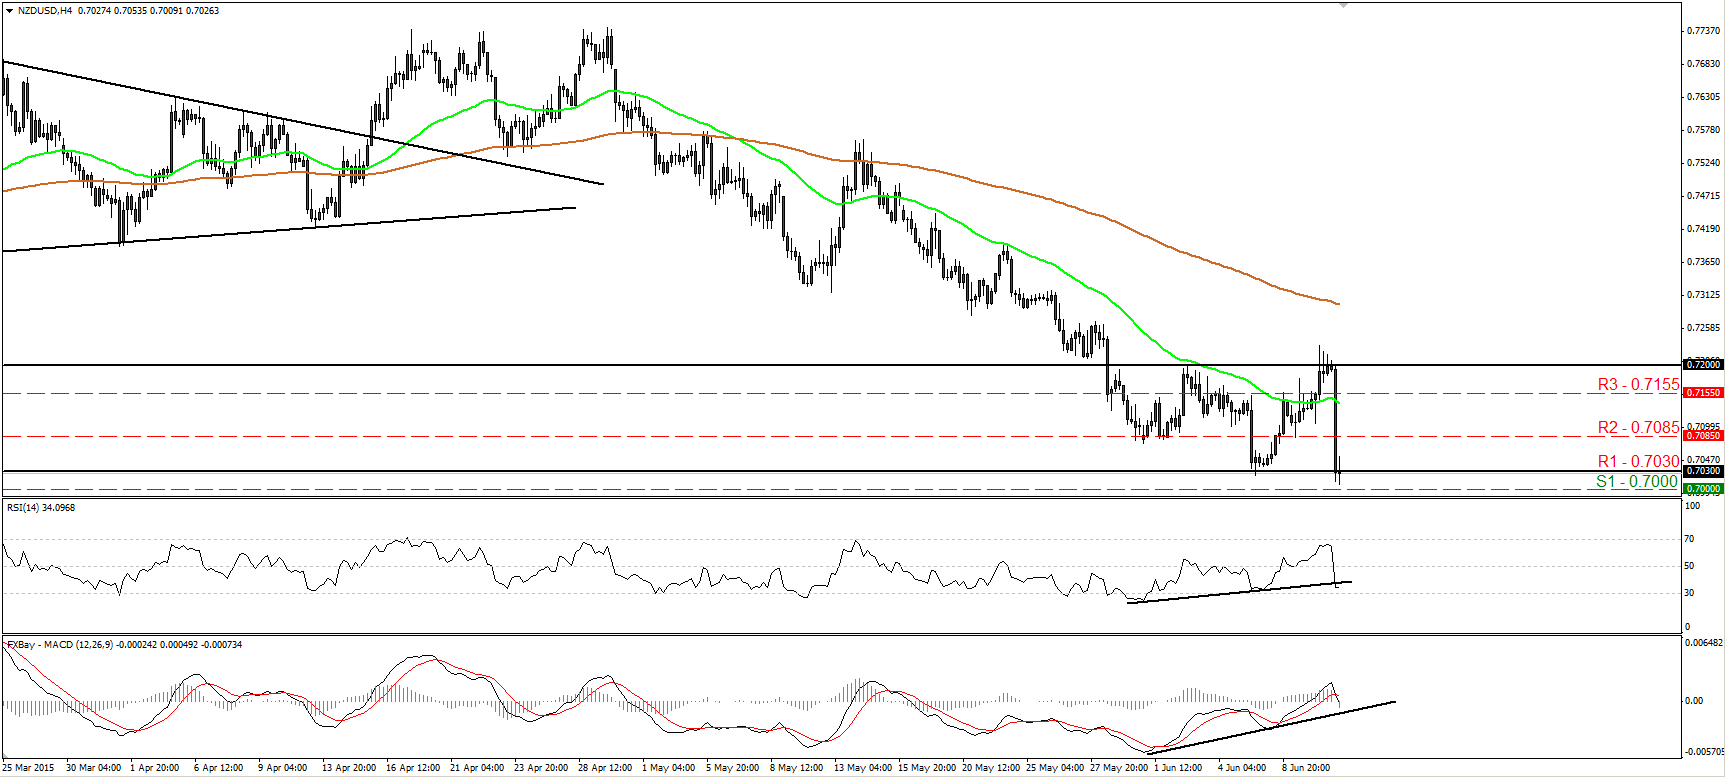
NZD/USD collapses after RBNZ cut rates
NZD/USD collapsed following the Reserve Bank of New Zealand decision to cut its benchmark interest rate by 25bps. The pair was trading near the 0.7200 barrier ahead of the event and as soon as the decision was published, it collapsed to trade a few pips below the 0.7030 (R1) hurdle. The prevailing longer-term path of the pair is to the downside, but I believe that a clear close below the round figure of 0.7000 (S1) is the move that could signal its resumption. Something like that is likely to initially challenge 0.6950 (S2), the low of the 25th of August 2010. Our daily oscillators have both turned down again, supporting the case that we are likely to see NZD/USD trading below 0.7000 (S1) soon. The 14-day RSI slid after hitting resistance below its 50 line, while the MACD, already negative, crossed again below its signal line.
• Support: 0.7000 (S1), 0.6950 (S2), 0.6820 (S3).
• Resistance: 0.7030 (R1), 0.7085 (R2), 0.7155 (R3).
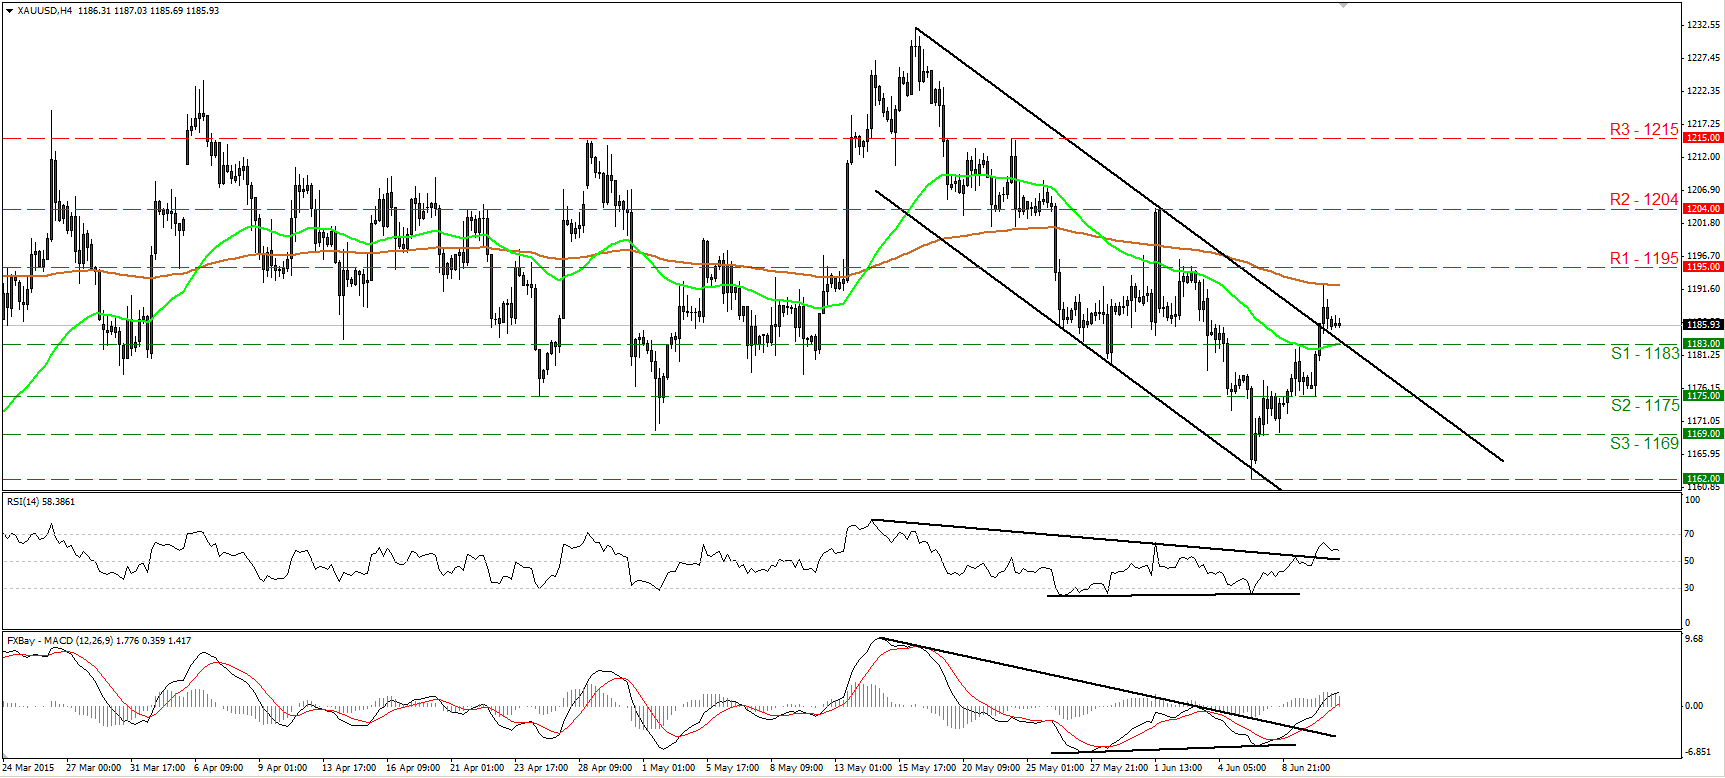
Gold breaks above the upper bound of a downside channel
Gold raced higher yesterday, breaking above the resistance (now turned into support) of 1183 (S1) and the upper bound of the downside channel that had been containing the price action since the 18th of May. However, the metal fell short of reaching our 1195 (R1) hurdle, and therefore I believe that a move above that line is needed to carry more bullish implications. Such a break is likely to pull the trigger for our next resistance at 1204 (R2). Yesterday’s rally confirmed the positive divergence between both the short-term oscillators and the price action. What is more, both these technical studies emerged above their respective downside resistance lines. On the daily chart, the move below 1169 (S1) on the 5th of June gives a first sign that the overall outlook has probably turned negative. As a result, I would treat any further short-term advances as a corrective phase.
• Support: 1183 (S1), 1175 (S2), 1169 (S3).
• Resistance: 1195 (R1), 1204 (R2), 1215 (R3).
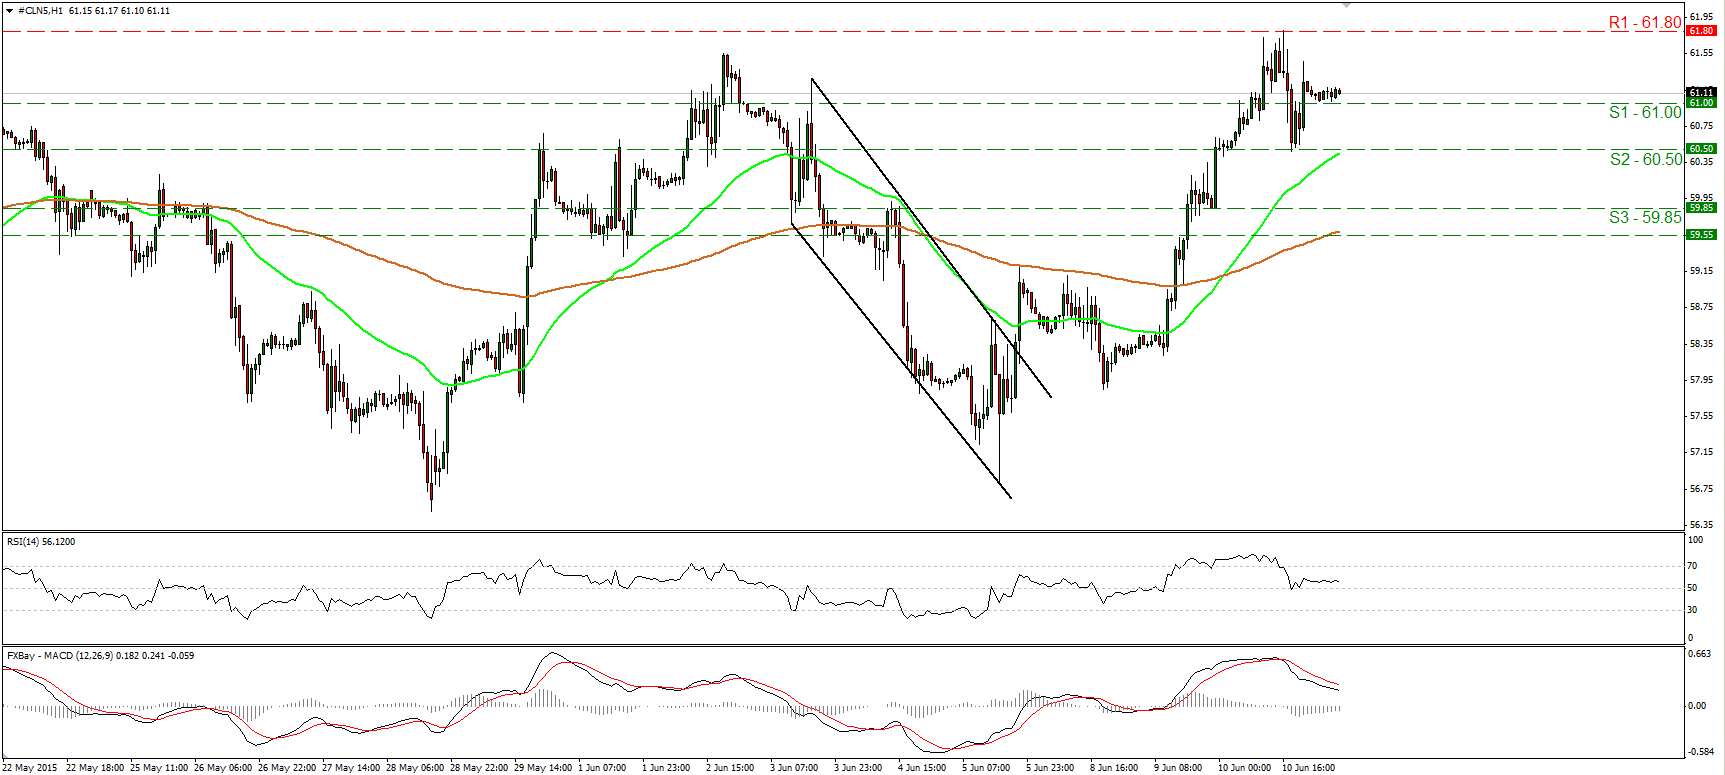
WTI hits resistance at 61.80
WTI continued trading higher on Wednesday, but after hitting resistance at 61.80 (R1), it pulled back to find support at 60.50 (S2). Subsequently, WTI rebounded to trade marginally above 61.00 (S1). The short-term picture stays positive in my view. Thus, I would expect another positive leg and another test at 61.80 (R1) in the near future. A clear move through that barrier is likely to open the way for the next resistance at 62.50 (R2). As for the broader trend, the break above 55.00 on the 14th of April signaled the completion of a double bottom formation, something that could carry larger bullish implications in the not-too-distant future. Our daily oscillators support further advances as well. The 14-day RSI rebounded from near its 50 line, while the daily MACD, already positive, has bottomed and poked its nose above its trigger line.
• Support: 61.00 (S1), 60.50 (S2), 59.85 (S3).
• Resistance: 61.80 (R1) 62.50 (R2), 63.50 (R3) .

