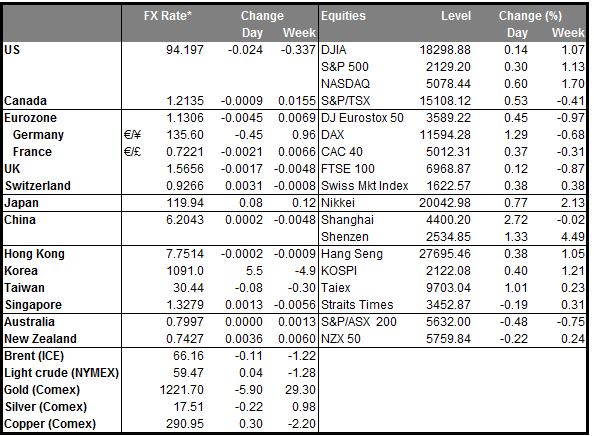
• What is the end game for Greece? I wrote yesterday that this was the endgame for Greece. How is it likely to play out?
• The big fear in the markets – the “nuclear option,” as it were – is that Greece defaults on its debt, abandons the euro and reinstates the drachma. This would of course cause chaos in Greece and huge losses among the other European countries that own Greek debt, directly or indirectly (through the ECB, etc.). To make matters worse, citizens in Spain, Portugal and maybe even Italy might worry that their country is next and send their savings en masse to Germany. That would be the biggest bank run in history and could cause the banking systems in those countries to collapse. Moreover, investors in other European countries holding stocks or bonds of those countries would suddenly have to hedge the currency risk. That could cause a huge flood of money out of the euro . The combination of the internal and external pressures could cause the euro to break up.
• Greek officials have been fanning the fears of the nuclear option. They reason that if it’s a choice between the nuclear option and a bail-out, the EU will go with the cheaper and safer option and come up with the money if they are scared enough.
• However, the EU seems to have a third possibility in mind. They seem to be slowly starving Greece of money by withholding funds and limiting the amount of Emergency Liquidity Assistance (ELA) that the ECB supplies to the banks until it finally capitulates and agrees to the EU’s demands. The next step may be to increase the haircut on the collateral that Greek banks have to put up for ELA funds, thereby further squeezing the banking system and the Greek economy.
• So what’s to prevent Greece from defaulting, leaving the Eurozone, reinstating the drachma, and carrying on with a clean slate and no debt? Several things:
1) Legally, Greece can’t leave the Eurozone without leaving the EU. That is the only way that a country can legally leave the euro. However, the government does not have a mandate to leave the EU. If they try, they may be voted out of office.
2) As long as they remain in the Eurozone, then European law only allows the euro as legal tender. The government would have to pay all wages, debts, pensions and bank deposits in euros.
3) Unfortunately, the country doesn’t have the money to do that. In 2014 Greece ran a small primary budget surplus (that is, revenues minus expenses not including interest payments) of 0.4% of GDP. When they started negotiating with the EU earlier this year, they expected a much larger primary surplus for 2015 of 4% of GDP. In that case, Greece could afford to default and alienate the markets, because it wouldn’t need to borrow any money so long as it didn’t have to pay any interest. However, the economy has slowed considerably since then and tax revenues have fallen, pushing the budget back into a primary deficit.
4) With a primary budget deficit, default and an exit from the euro would be worse for the Greeks than the hated austerity program. The government would not have the money to meet its campaign promises and would have to default to its own citizens, cutting pensions and public services while probably redenominating bank deposits into a much weaker currency.
• If either or both of those events happened, no doubt support for the government would collapse and the government would be voted out. I expect that once PM Tsipras and his colleagues realize that, then they will reluctantly agree to whatever demands their creditors make. My guess is that this will involve a referendum so that they can get public approval to renege on their campaign promises. At which point the party may split up and a new government form that in fact will have policies much like the previous one, after all is said and done.
• RBA confirms it retains the option to ease The Reserve Bank of Australia (RBA) released the minutes of its May policy meeting. At that meeting, the Bank cut its Cash Rate (CR) by 25bps as expected but removed the easing bias that it had in the previous statements, causing some investors to speculate that it had reached the end of its easing cycle. The minutes confirmed that the decision to remove forward guidance had been deliberate, but does not limit the board’s scope for easing further at future meetings. In other words, the RBA retains a sort of a soft or unstated easing bias as they see the risks to the economy and inflation largely on the downside. AUD weakened sharply on the report, but quickly bounced back to trade unchanged a few hours later. I remain bearish however as I believe the gradual rebalancing of China’s economy will work to Australia’s detriment.
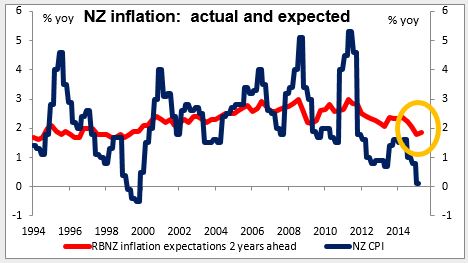
• New Zealand inflation expectations rise The average inflation expectations of private-sector analysts and businesses two years ahead for New Zealand rose slightly in Q2 to 1.85% from 1.80%, according to the Reserve Bank of New Zealand. Reserve Bank of New Zealand (RBNZ) Gov. Wheeler has said he would consider cutting the benchmark Official Cash Rate (OCR) if near-zero headline inflation starts to weigh on the outlook and change price-setting behaviour, but today’s data shows that this is not the case. Expectations of a rate cut in June fell as a result and NZD moved sharply higher vs both USD and AUD. The interest rate outlook now favors NZD relative to AUD.
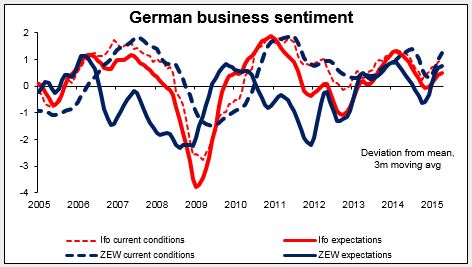
• Today’s highlights: During the European day, the German ZEW survey for May is coming out. The survey for April was mixed with the current situation index improving for the sixth consecutive month, but the expectation index declined a bit after five monthly gains. Following the latest round of weak German data, a strong survey is needed to confirm that the country is still gaining momentum. However, the market expects both figures to be below their April level, which could prove negative for EUR today.
• In the UK, we get the CPI for April. As mentioned in the Bank of England’s quarterly inflation report, inflation could temporarily turn negative in the near term. Nevertheless, it is expected to pick up notably towards the end of the year as the past falls in prices, especially of oil , drop out of the annual comparison. Expectations are that the yoy rate of change will remain the same at zero, which would probably be neutral for GBP.
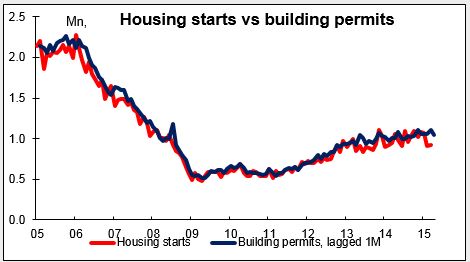
• In the US, housing starts and building permits for April are to be released. Housing starts are forecast to return to above 1mn, indicating that March’s moderate increase was probably due to the harsh winter. Building permits, the more forward-looking of the two indicators, are forecast have increased a bit, keeping the overall trend consistent with an improving housing market. The strength in the housing sector supports the view that growth in Q2 could rebound somewhat and this could strengthen the greenback a bit.
• As for the speakers, Riksbank Governor Stefan Ingves and Bank of Canada Governor Stephen Poloz speak. Ingves said Monday that it’s important to ensure that SEK stays roughly where it is vs EUR and that he sees a weak krona “for some time to come” to support CPI. EUR/SEK declined 0.54% on the day nonetheless. I would expect him to reassert his “weak krona” comments Tuesday in order to reverse this move.
The Market
EUR/USD pulls back
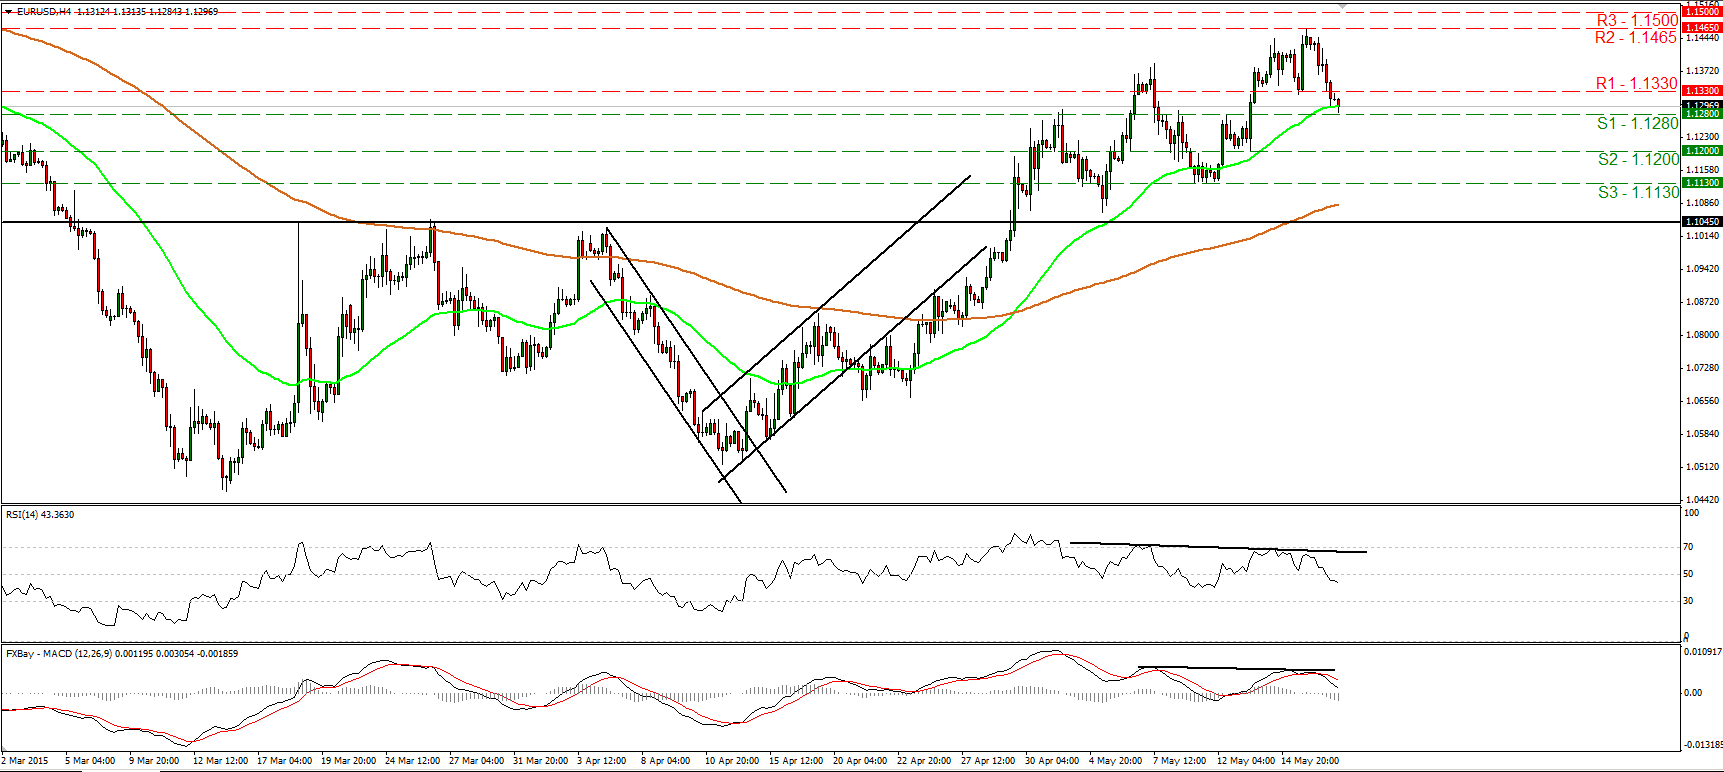
• EUR/USD tumbled on Monday, fell below the support (turned into resistance) barrier of 1.1330 (R1), and is testing the support line of 1.1280 (S1) during the European morning Tuesday. Although the short-term outlook stays somewhat positive, I believe that the corrective move is likely to continue for a while. A break below 1.1280 (S1) could confirm that and perhaps pave the way for the next support at 1.1200 (S2). Our oscillators detect negative momentum and support the case for further retracement. The RSI continued lower and fell below its 50 line, while the MACD, although positive, stands below its trigger line and points north. There is also negative divergence between both the indicators and the price action. As for the broader trend, the break above 1.1045 signaled the completion of a possible double bottom formation, something that could carry larger bullish implications. I would treat any possible downside extensions as a corrective move, at least for now.
• Support: 1.1280 (S1), 1.1200 (S2), 1.1130 (S3)
• Resistance: 1.1330 (R1), 1.1465 (R2), 1.1500 (R3)
GBP/JPY trades in a consolidative manner
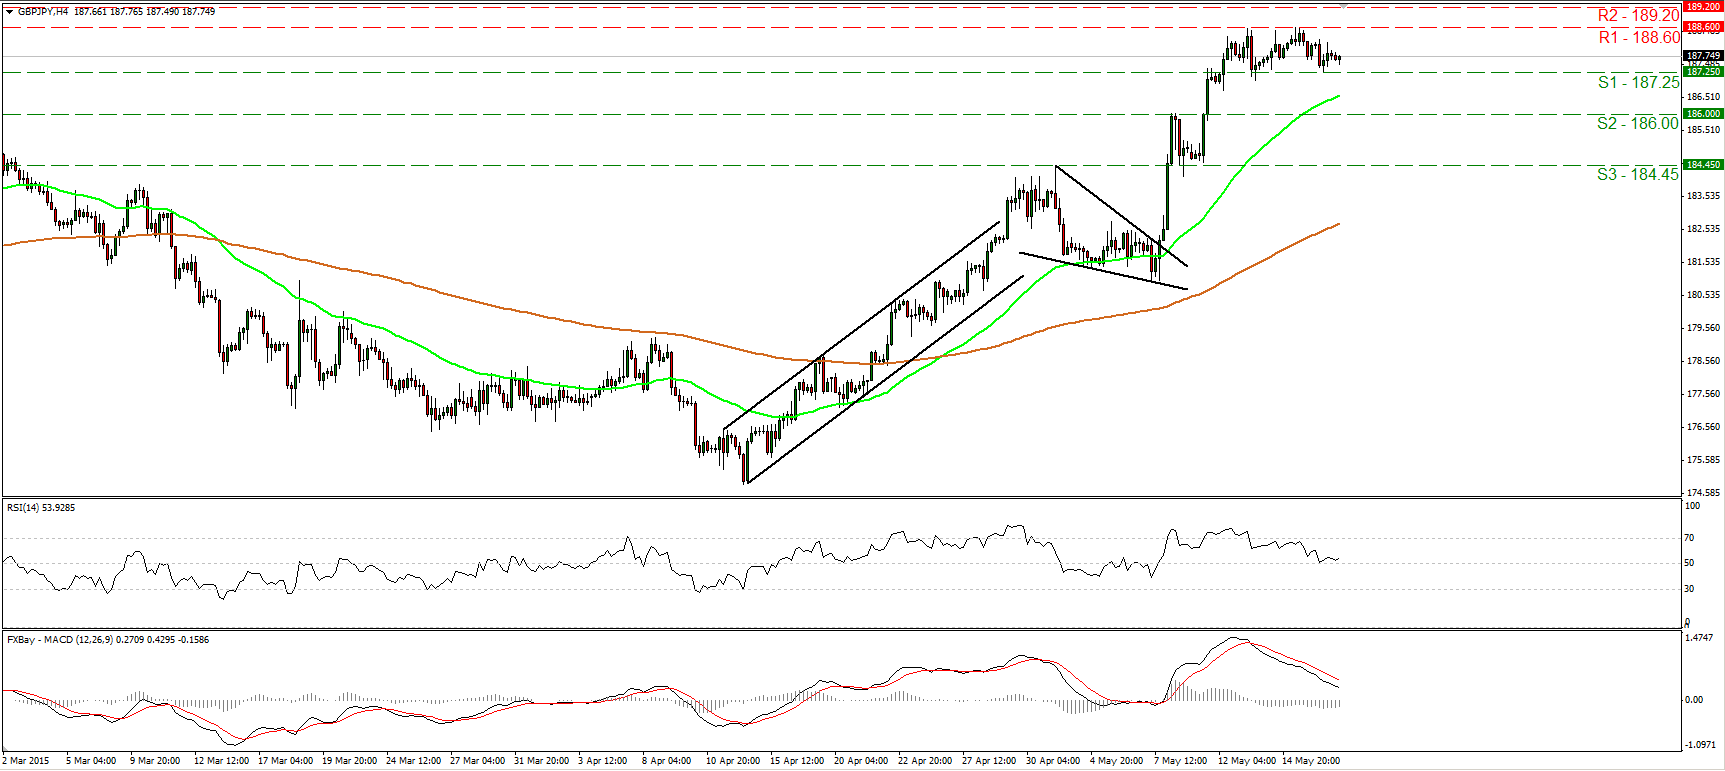
• GBP/JPY has been trading in a consolidative manner for a week now, between the support barrier of 187.25 (S1) and the resistance of 188.60 (R1). The short-term trend remains positive, but I believe that a downside corrective move could be on the cards before the bulls pull the trigger again. A break below 187.25 (S1) is likely to trigger the corrective move and perhaps challenge the 186.00 (S2) area. Our momentum indicators detect slowing momentum and support the case that we are likely to see GBP/JPY correcting lower. The RSI slid and now lies near its 50 line, while the MACD, although positive, has been standing below its trigger and points down. On the daily chart, the rate is trading well above both the 50- and the 200-day moving averages, and this supports the continuation of the short-term uptrend. However, our daily momentum indicators give evidence of a possible correction as well. The 14-day RSI turned down within its overbought territory, while the daily MACD shows signs of topping.
• Support: 187.25 (S1), 186.00 (S2), 184.45 (S3)
• Resistance: 188.60 (R1), 189.20 (R2), 189.80 (R3)
NZD/USD gains on higher inflation expectations
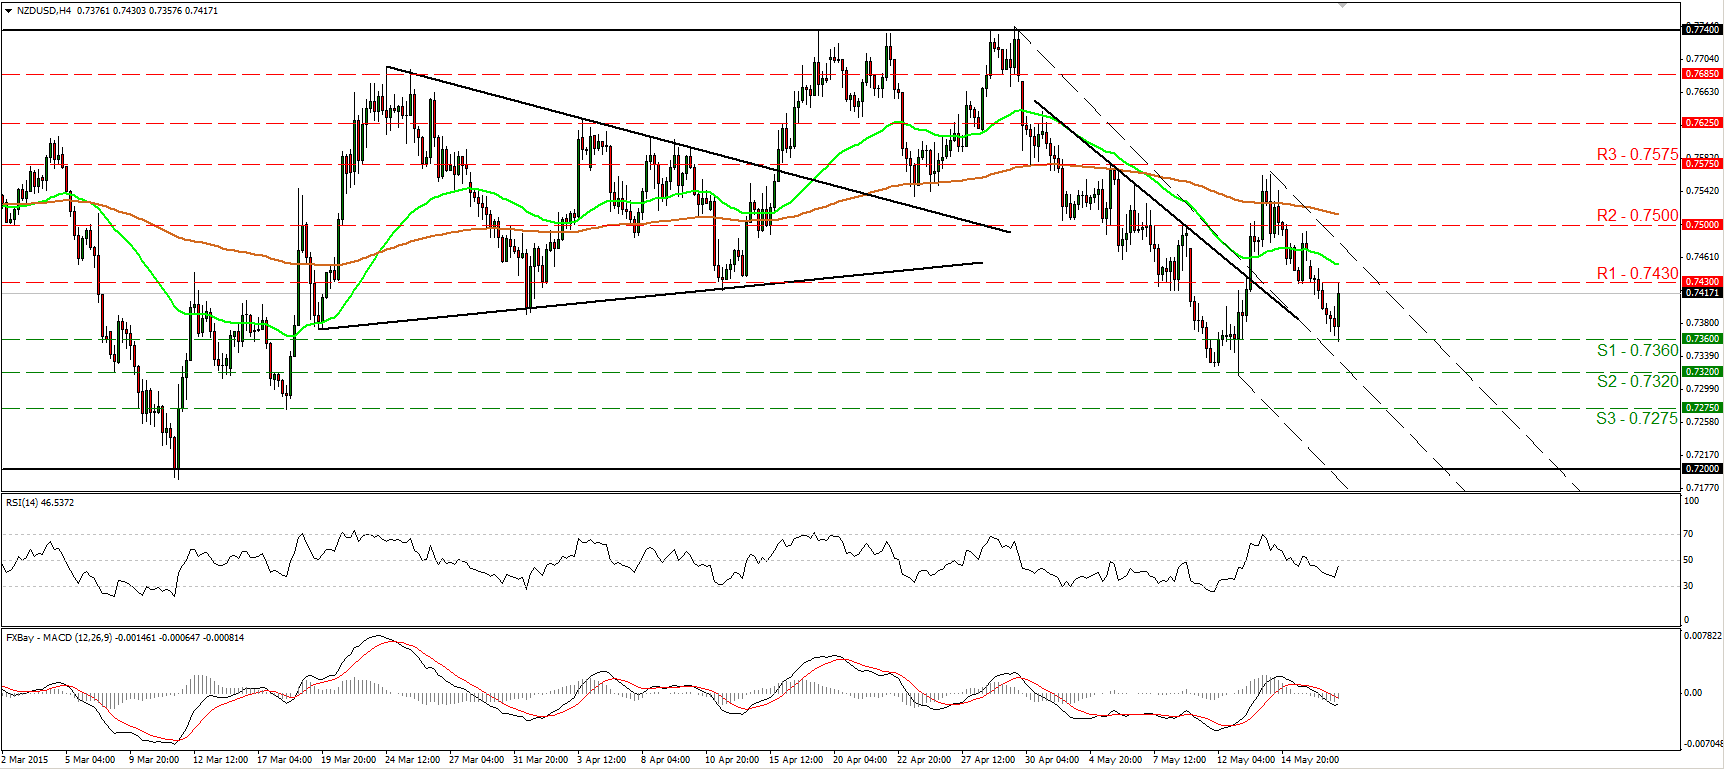
• NZD/USD rallied during the Asian morning Tuesday after the RBNZ reported higher inflation expectations. The pair rebounded from 0.7360 (S1) and is now testing the resistance of 0.7430 (R1). Even though the rebound may continue for a while, the short-term picture remains negative in my view. I would expect the bears to eventually take control and go for another test at the 0.7360 (S1) line. A break through that could target the 0.7320 (S2) hurdle. On the daily chart, Thursday’s candle looks like a shooting star formation, which supports further declines. However, I would like to see a clear close below the 0.7200 area before I start discussing the resumption of the prior longer-term downtrend.
• Support: 0.7360 (S1), 0.7320 (S2), 0.7275 (S3)
• Resistance: 0.7430 (R1), 0.7500 (R2), 0.7575 (R3)
DAX futures rebound from 11420
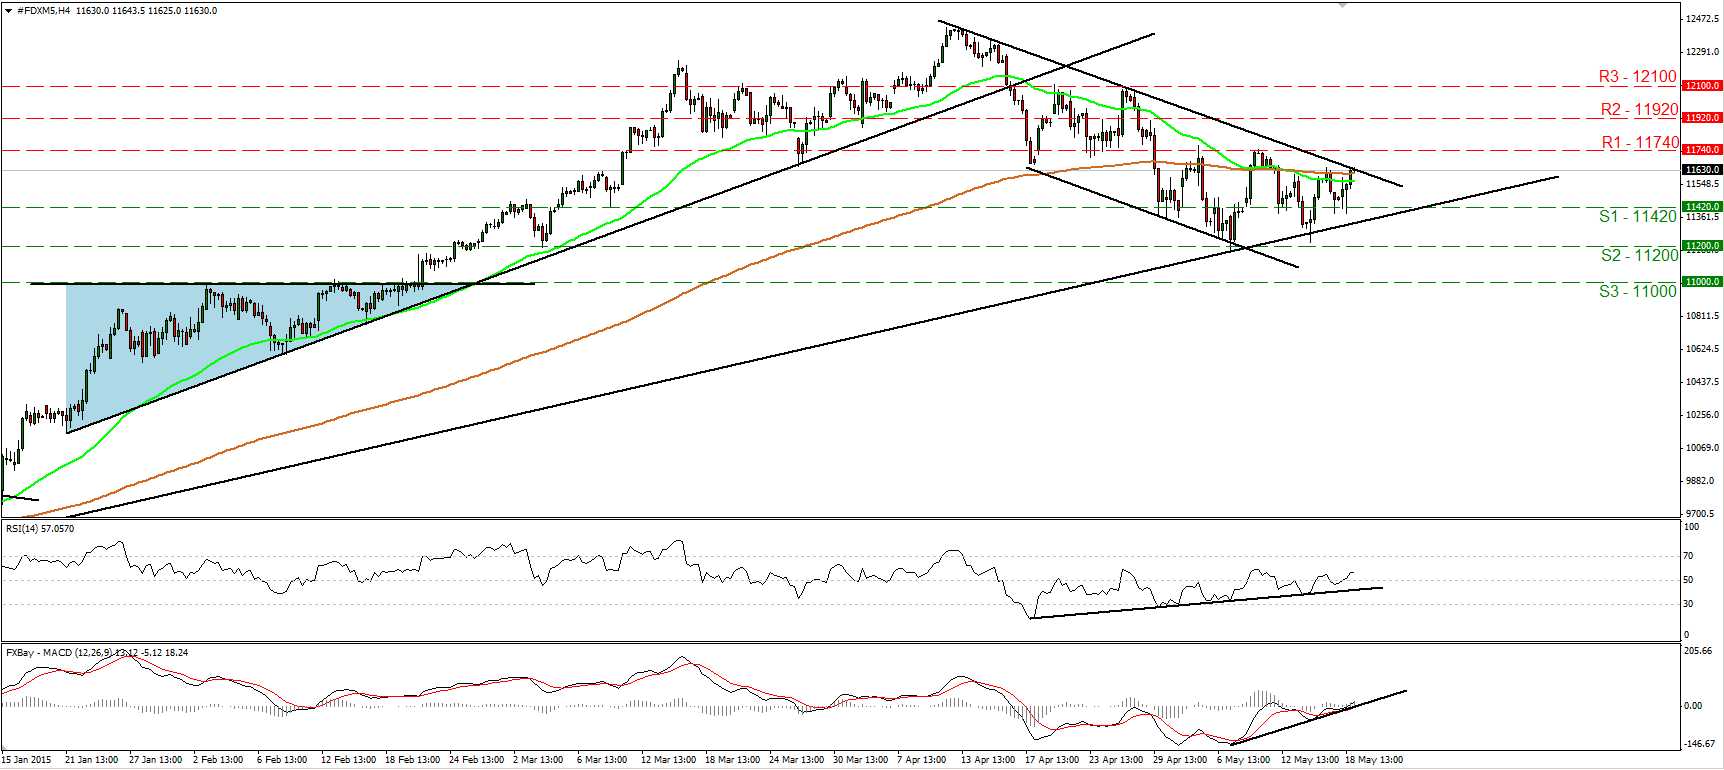
• DAX futures traded higher on Monday after finding support at 11420 (S1). A move above 11740 (R1) will probably confirm that the down move started on the 10th of April was just a corrective move and that the larger trend is back in force. Such a move is likely to initially challenge our next resistance at 11920 (R2). Our short-term oscillators reveal positive momentum and amplify the case for further advances. The RSI is back above its 50 line, while the MACD stands above both its signal and zero lines, pointing somewhat north. On the daily chart, the index shows signs that it could rebound from the long-term uptrend line taken from back at the low of the 16th of October. This keeps the longer-term path of the index to the upside in my view.
• Support: 11420 (S1), 11200 (S2), 11000 (S3)
• Resistance: 11740 (R1) 11920 (R2), 12100 (R3)
Gold hits resistance around 1232 and pulls back
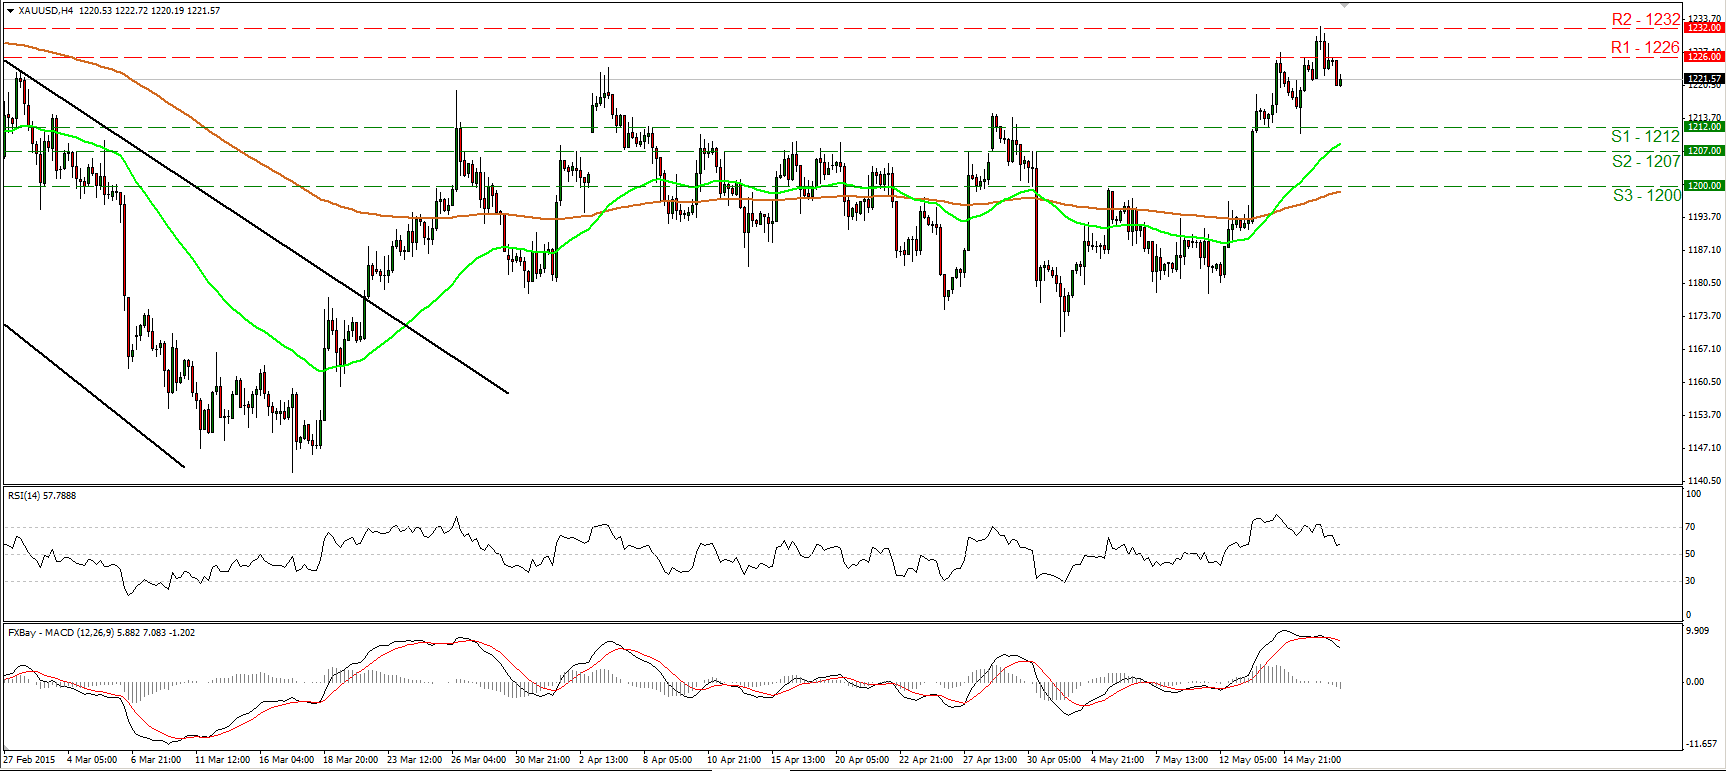
• Gold raced higher on Monday, but the advance was halted near the 1232 (R2) level. Subsequently, the metal pulled back and is now trading back below 1226 (R1). Taking a look at our short-term oscillators, I see signs that the pullback could continue, perhaps for a test at the 1212 (S1) territory. The RSI tumbled after exiting its above-70 territory, while the MACD has topped and fallen below its trigger line. On the daily chart, Monday failed to close above 1226 (R1). I believe that a decisive close above that barrier is needed to turn the medium-term bias to the upside. For now, I will maintain my neutral stance as far as the longer-term trend is concerned.
• Support: 1212 (S1), 1207 (S2), 1200 (S3)
• Resistance: 1226 (R1), 1232 (R2), 1245 (R3)

