
Equity indices slid yesterday and during the Asian morning today, with the NASDAQ and the S&P 500 being the main losers, as investors abandoned tech stocks. Today, the spotlight is likely to fall on the US employment data for August, with the risks surrounding the nonfarm payrolls forecast being tilted to the downside. In or view, the big question is how the stock market will respond to a potential soft report.
How Will The Markets Respond To The Nonfarm Payrolls?
The US dollar traded mixed against the other G10 currencies on Thursday and during the Asian morning Friday. It gained against NZD, AUD, CAD, NOK, and GBP in that order, while it underperformed versus CHF, EUR, SEK, and JPY.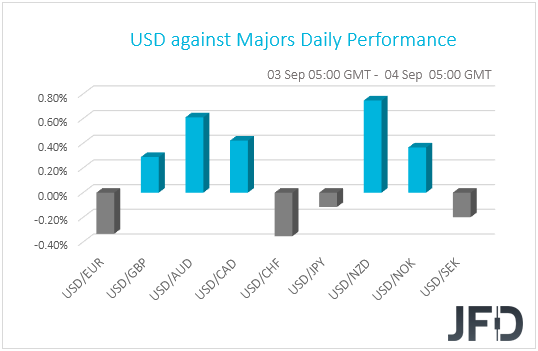
The weakening of the risk-linked Aussie and Kiwi, combined with the strengthening of the safe-havens yen and franc, suggests that investors reduced their risk exposures. Indeed, looking at the performance in the equity world, we see that major EU and US indices were a sea of red, with the negative investor morale rolling into the Asian session today. The exception was Spain’s IBEX 35 which gained 1.3%. The main losers were the Nasdaq and the S&P 500 as investors abandoned the sky-flying tech stocks.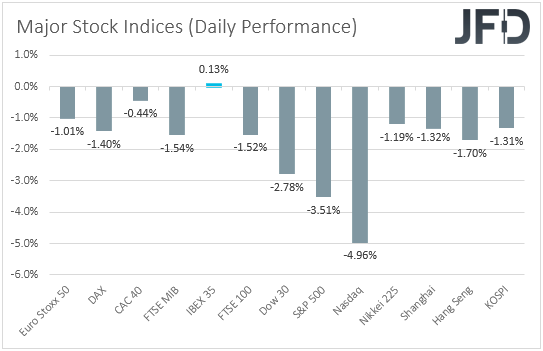
With the tech sector being the main outperformer recently, it appears more than normal to us for tech stocks to suffer the most during a selling phase. In our view, this may have been the result of some profit-taking ahead of today’s US employment data for August. Expectations are for the NFPs to show that the economy has gained 1.400mn jobs, after adding 1.763mn in July. However, bearing in mind that on Wednesday, the ADP reported that the private sector gained only 428k jobs, we would consider the risks surrounding the NFP forecast as tilted to the downside. The unemployment rate is expected to have declined to 9.8% from 10.2%, while average hourly earnings are anticipated to have slowed to +4.5% yoy from +4.8%.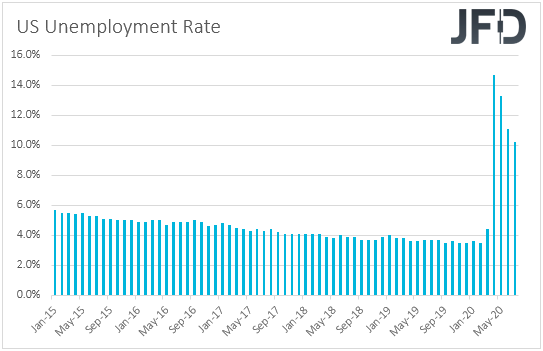
Last week, speaking at the Jackson Hole economic symposium, Fed Chief Powell said that the Fed will now target a 2% average inflation and put emphasis on “broad and inclusive” employment, with the shift motivated by underlying changes to the economy, including lower potential growth, persistently lower interest rates and low inflation. Although he added that the Committee is not tying itself to any particular method to define “average” inflation, this means that the Fed is willing to tolerate above 2% inflation for a while before raising interest rates, which implies extra-loose monetary policy for longer. What’s more, in the minutes of the latest FOMC gathering, it was revealed that additional accommodation may be required.
With all that in mind, we believe that a softer-than-expected report would add to speculation for more easing by the Fed and perhaps hurt the dollar. The big question though is how the equity market will respond. On the one hand, equities could retreat on signs of a slower economic recovery, while on the other hand, they could gain on increased speculation for more easing. Our humble view is that, even if they initially retreat, expectations of ultra-loose policy for longer may eventually result in a rebound. Thus, we will stick to our positive view with regards to equities and other risk-linked assets. At the same time, we expect investors to divert more money out of the safe havens, like the Japanese yen and the Swiss franc.
S&P 500 – Technical Outlook
Yesterday, the S&P 500 failed to overcome Tuesday’s high, at 3588, which is also currently the all-time high, and instead it sold off heavily. The price found support near the 21-day EMA, from which the cash index is bouncing this morning. However, if suddenly the index falls below that 21-day EMA, we could see a continuation move south. But let’s not forget that the S&P 500 is still trading above a medium-term upside support line drawn from the low of May 14th. If that line remains intact, that might help the bulls to get back into the game. For now, we will take a somewhat positive approach.
As mentioned above, if the price moves lower, but gets held by the aforementioned upside line, the bulls may take charge again. That could drive the index higher, possibly aiming for the 3487 hurdle again, marked near the lows of August 31st and September 1st. If the buying-interest is still strong, a break of that hurdle might set the stage for a move to the current all-time high, at 3588.
Alternatively, if the previously-discussed upside line breaks and the price slides below the 3327 zone, marked by the low of August 11, that may lead the S&P 500 further south, as this might signal a change in the medium-term trend. The index could then drift to the 3280 obstacle, a break of which may set the stage for a fall to the 3199 level. That level is marked near the lows of July 15, 16, 17, 24, 27 and 30.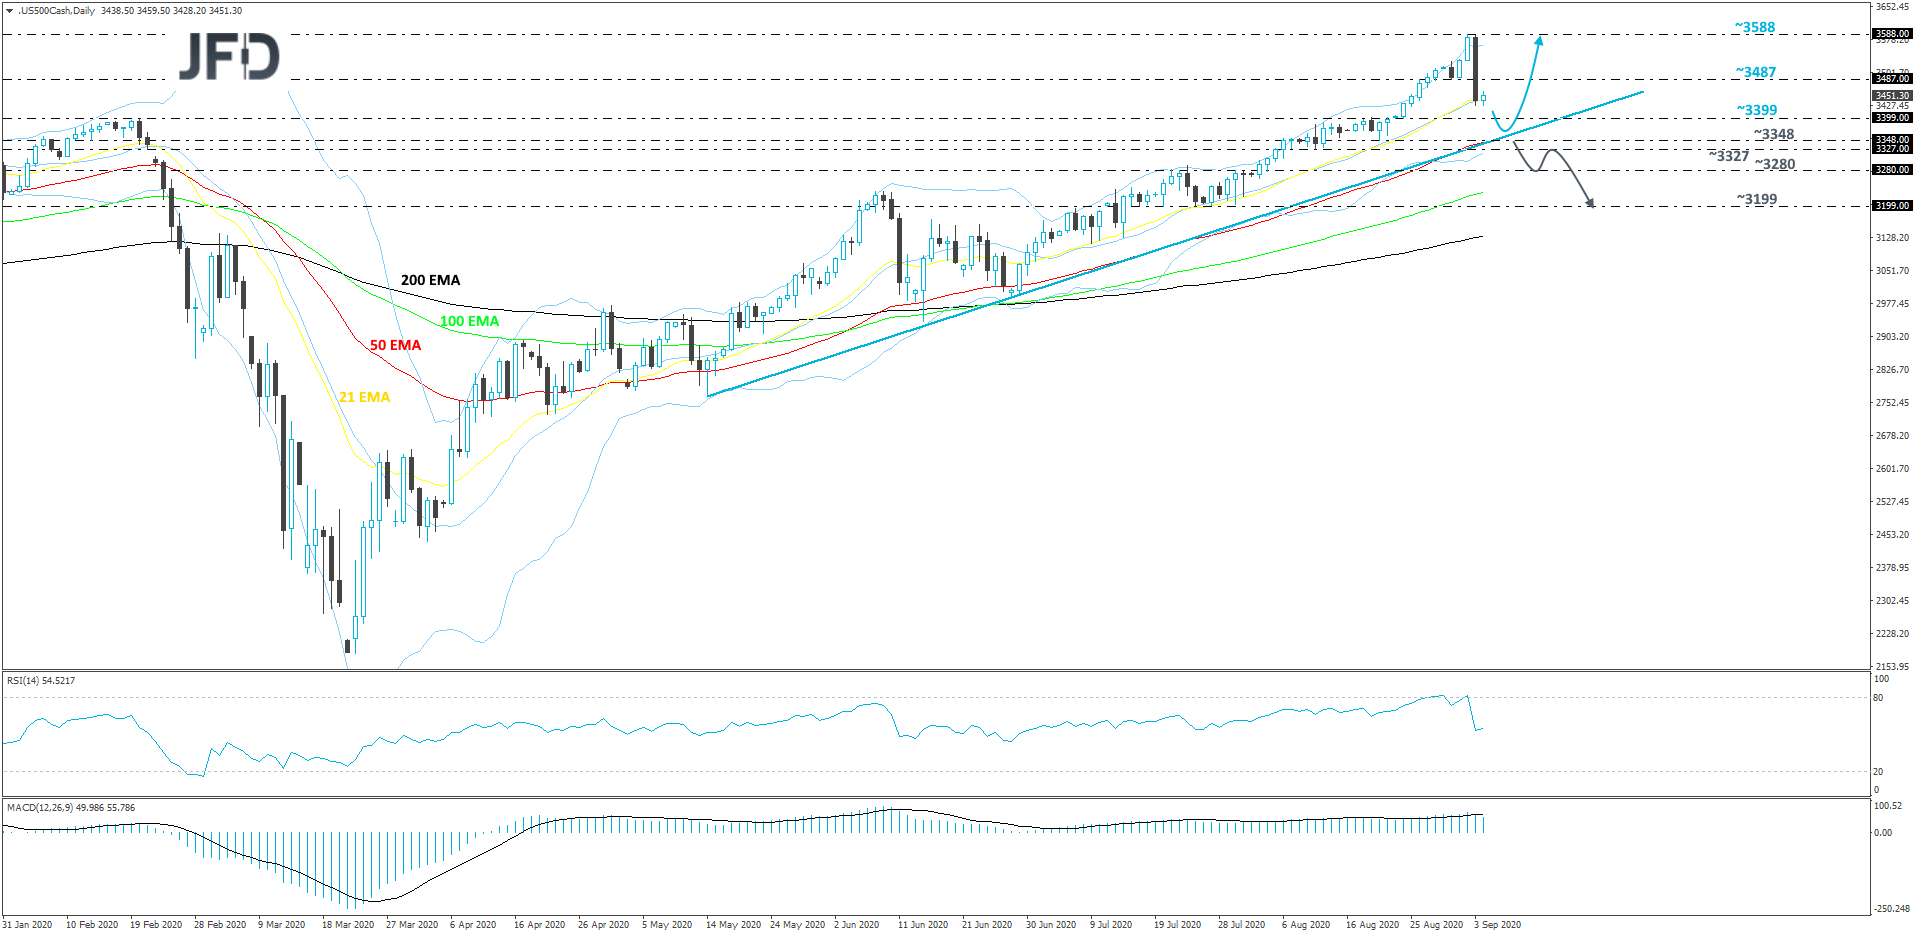
GBP/USD – Technical Outlook
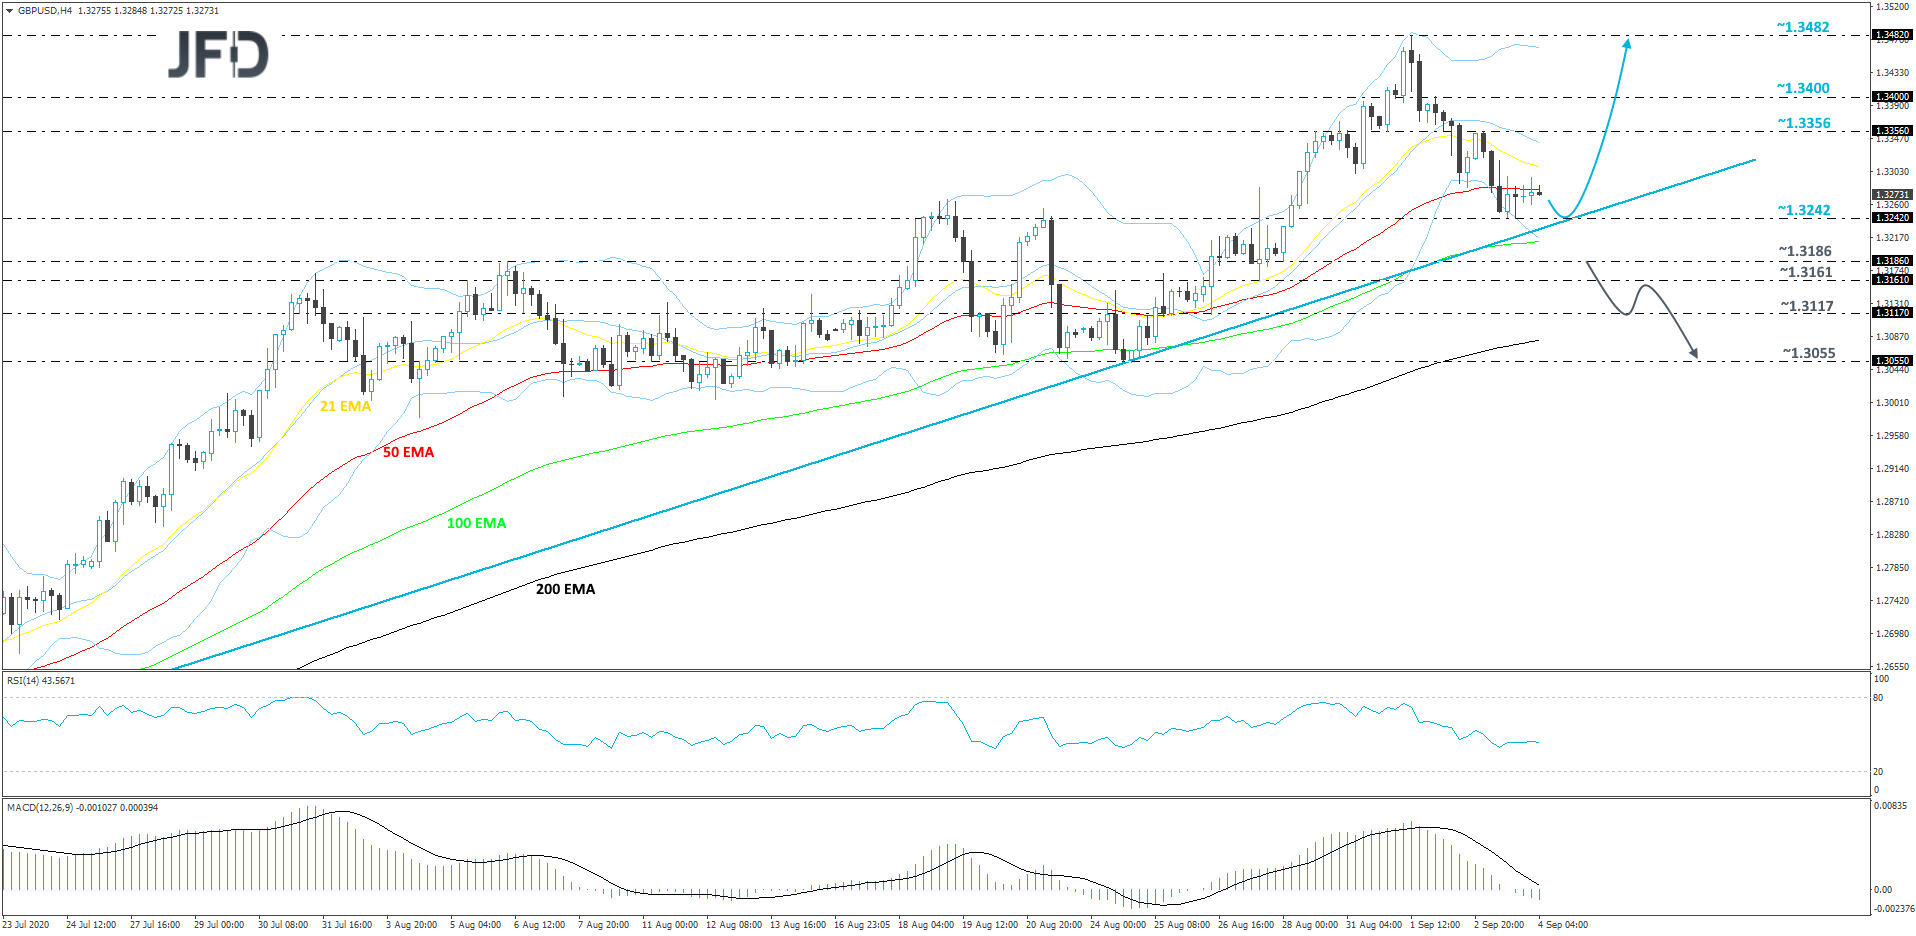
After finding resistance near the 1.3482 hurdle in the beginning of this week, GBP/USD started moving slightly lower. Overall, the pair continues to trade above a short-term tentative upside support line drawn from the low July 20th. Although the rate is currently in a sliding mode, as long as that upside line stays intact, this move down could be seen as a temporary correction, before another possible move higher. That’s why for now, we will remain positive overall.
If the pair slides a bit lower, but fails to break the aforementioned upside line, the bulls might get interested again and get back into the action. If so, GBP/USD may get pushed back to the 1.3356 hurdle, a break of which could clear the way to the 1.3400 zone, which marks the high of September 2. The rate might stall there for a bit, or even correct slightly lower. That said, if the pair stays above the 1.3356 area, the buyers could join in again and drive GBP/USD higher, potentially bypassing the 1.3400 zone and aiming for the high of this week, at 1.3482.
Alternatively, if the aforementioned upside line breaks and the rate slides below the 1.3186 hurdle, marked by the low of August 28, that may spook the bulls from the field temporarily, allowing more bears to join in. GBP/USD could then drift to the 1.3161 obstacle, a break of which might set the stage for a drop to the 1.3117 area, marked by the low of August 26. The rate may get a hold-up around there, but if the sellers are still feeling a bit more confident, a further decline might bring the pair to the 1.3055 level. That level marks the low of August 24.
As For The Rest Of Today's Events
During the European session, the UK construction PMI for August is coming out and expectations are for the index to have risen somewhat, to 58.5 from 58.1.
Later in the day, apart from the US jobs report, we get employment data for August from Canada as well. The unemployment rate is expected to have declined to 10.2% from 10.9%, while the net change in employment is forecast to show that the economy has added 275.0k jobs after gaining 418.5k in July.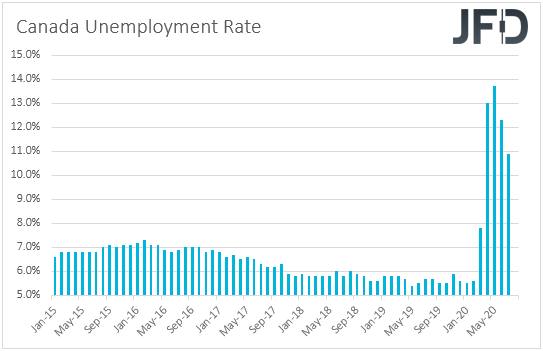
At its last meeting, the BoC decided to keep interest rates unchanged at +0.25% and noted that they will stay there until the 2% inflation target is sustainably achieved. Officials also added that they will continue with their QE program until the economic recovery is well underway, and that they stand ready to adjust their programs if market conditions change. With that in mind, and also taking into account that last Friday’s GDP data showed that the Canadian economy performed better than expected in June, despite sliding 38.7% on a qoq annualized basis, we believe that a relatively good employment report may allow BoC policymakers to stand pat for a while more.
As for the speakers, we have two on today’s agenda: ECB Chief Economist Philip Lane and BoE MPC member Michael Saunders.