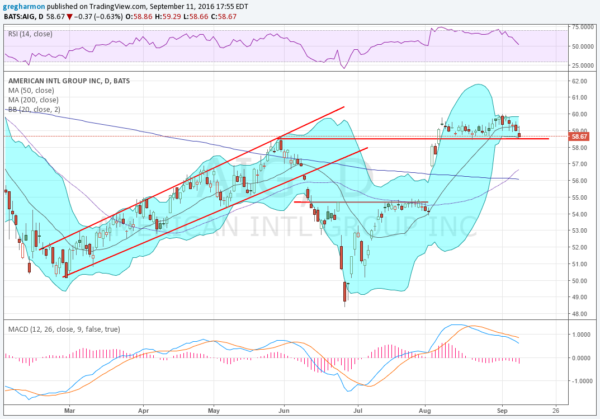
American International Group Inc (NYSE:AIG), had a steady run higher off of a bottom in February. Rising in a channel, it moved higher for 3 months until reaching a peak at 58.50 at the end of May.
The price fell from there making a lower low following the Brexit reaction. It moved back higher to short term resistance then, and gapped higher following their earnings report August 3rd. A few days later in made a new high over the important 58.50 level and has been consolidating there ever since.
8 days ago the Bollinger Bands® started to squeeze in and it started moving lower in the range ending Friday at the bottom. The RSI has pulled back to the mid line, remaining in the bullish zone but trending lower.
The MACD is falling but positive. Wednesday last week the stock printed a Golden Cross, with the 50 day SMA crossing up through the 200 day SMA. That is a bullish signal.
There is resistance at 60 to the upside and then 63.50 before very thin prior price history. Support below 58.58 stands at 56.80 and then there is a gap to fill to 54.50. Short interest is low at 1.3%. The company is due to report earnings next November 2nd and the stock goes ex-dividend September 13th.
The September options chain shows large open interest on the call side at the 55 strike and on the put side at the 50 strike. These suggest a downward bias this week.
October options are also biased lower, but not as much so, with the largest put open interest at 52.50 and largest open interest on the call side at 57.50. Finally the November options, the first beyond the earnings report, shifts the price range to 57.5 to 60 based on open interest.
AIG
Trade 1: If you are long the stock you might consider adding a collar for protection. Given the gap in the chart an October 14 Expiry 58.5/54.5 Put Spread would protect for a gap fill. This was offered at $1.13 late Friday. By selling the November 60 Calls, which were bid at $1.27 Friday, you can cover the entire cost of the protection.
Trade 2: If you want to own this stock on a gap fill then you might consider a 1×2 Put Spread. The October 57.5/55 1×2 Put Spread, buying a 57.5 Put and selling 2 of the 55 Puts, was offered at 18 cents late Friday. This would give participation in the downside under 57.5 until a maximum profit at 55. Under 55 you would be put the stock but with a basis of 52.50.
Trade 3: You can participate in the downside by selling the stock short on a move under 85.50. Add an October 60 Call, offered at 72 cents late Friday, as guaranteed protection against a move or gap higher.
Disclaimer: The information in this blog post represents my own opinions and does not contain a recommendation for any particular security or investment. I or my affiliates may hold positions or other interests in securities mentioned in the Blog, please see my Disclaimer page for my full disclaimer.
