The U.S. dollar extended its recent drop against the euro on Monday, however, comments from Federal Reserve vice chairman Stanley Fischer and leaders in Europe discussing the Greek financial crisis had little impact on currency prices in afternoon trading. In addition, Fischer added that a "smooth plan upward will certainly not be realized," as the Fed has no plans for regular rate hikes. Elsewhere, Greece Prime Minister Alexis Tsipras and German chancellor Angela Merkel put on a public display of goodwill during Tsipras' first visit to Berlin since he was elected earlier this year. Still, there were no indications on whether any progress had been made in negotiations on extending the euro zone's bailout package to Greece during talks on Monday.
The euro pushed higher against the U.S. dollar on Monday, amid hopes for progress on the Greek debt front, while uncertainty over the timing of a U.S. rate hike continued to dampen demand for the greenback. The pair reached the highest level since March 18 and then consolidated around 1.0930. The euro found support after Greek authorities said on Friday that they were moving towards meeting the requirements of international creditors on a more detailed reform plan in order to secure the additional bailout funds required. For Tuesday the euro zone is to produce survey data on private sector activity while on the U.S. front, reports on consumer inflation and new home sales are to be released.
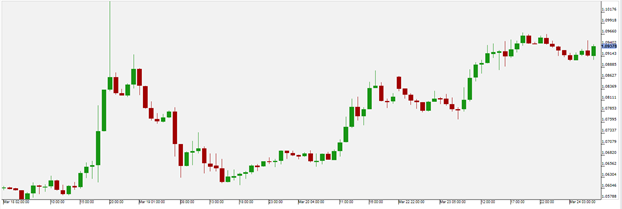
Pivot
1.087
Support
1.087
1.0815
1.075
Resistance
1.0985
1.104
1.109
Scenario 1: Long positions above 1.087 with targets @ 1.0985 & 1.104 in extension.
Scenario 2: Below 1.087 look for further downside with 1.0815 & 1.075 as targets.
Comment: The pair has validated a bullish flag and remains on the upside.
Janet Yellen supported gold buyers when she signaled that the Fed is in no rush to raise interest rates.
Gold posted its biggest weekly gain in two months on the prospect that U.S. rates will stay lower for longer. The dollar had the steepest weekly slide since 2011 after the comments, providing an additional boost on the precious metal. Following the statement, investors are focusing on macroeconomic indicators for further indications on the strength of the U.S economy
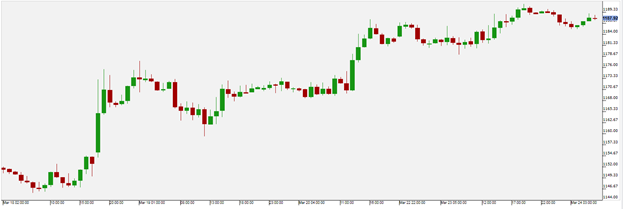
Pivot
1178.5
Support
1178.5
1169
1160
Resistance
1200.8
1209.6
1218
Scenario 1: Long positions above 1178.5 with targets @ 1200.8 & 1209.6 in extension.
Scenario 2: Below 1178.5 look for further downside with 1169 & 1160 as targets.
Comment: The RSI is mixed to bullish.
OIL/USD
Oil prices dropped on Tuesday after activity in China's factory sector fell to an 11-month low and as Saudi Arabia said its production was close to an all-time high, almost 10 million barrels per day.
Tumult in Libya, U.S. rig counts, production plans of the oil exporting cartel and a pact on nuclear relations with Iran are all affecting crude supply and demand, but oil traders have kept their view that a bottom might be in sight, and are now pouring more money into financial products backed by oil. This week, focus will be on Wednesday's crude oil inventories..
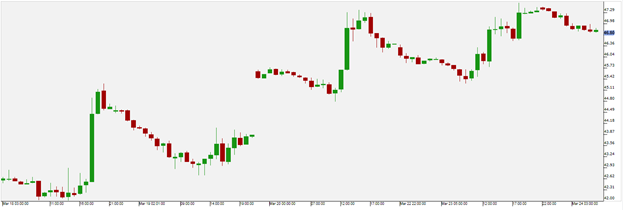
Pivot
45.4
Support
42
44.8
44
Resistance
48.15
48.9
49.5
Scenario 1: Long positions above 45.4 with targets @ 48.15 & 48.9 in extension.
Scenario 2: Below 45.4 look for further downside with 44.8 & 44 as targets.
Comment: The RSI is mixed.
DOW/USD
Stocks on U.S. equities markets fell slightly amid a weakening dollar, as investors weighed fluctuations in the dollar and its impact on other markets, including crude prices. The Dow Jones Industrial Average was pressured by weakness in the Financials, Health Care and Industrials sectors while modest gains in the Consumer Goods, Telecommunications and Basic Materials sectors, limited losses. For today investors will be focusing on reports for consumer inflation and new home sales from the U.S.
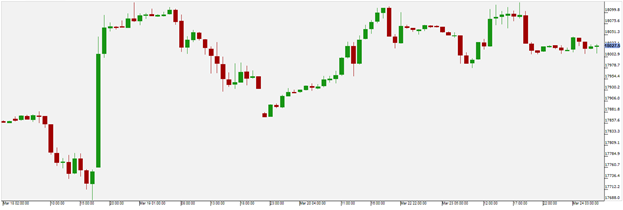
Pivot
17040
Support
17040
16330
15860
Resistance
18290
18900
19200
Scenario 1: Long positions above 17040 with targets @ 18290 & 18900 in extension.
Scenario 2: Below 17040 look for further downside with 16330 & 15860 as targets.
Comment: The RSI is above its neutrality area at 50%.
The price target on Facebook's stock was increased to $97 from $94 at JMP Securities Monday, due to optimism leading up to the social network's annual developer conference next week in San Francisco. The brokerage cited increased its 2015 revenue target to $16.9 billion, saying Facebook Inc (NASDAQ:FB) is well positioned to take a greater share of the overall advertising market.
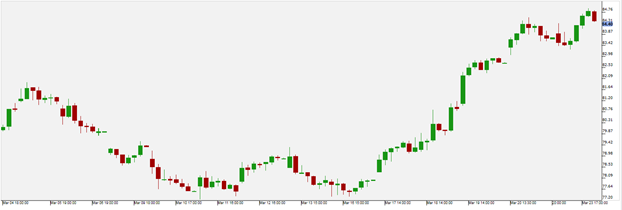
Pivot
77
Support
77
73.3
68.45
Resistance
89.5
94.5
101.7
Scenario 1: Long positions above 77 with targets @ 89.5 & 94.5 in extension.
Scenario 2: Below 77 look for further downside with 73.3 & 68.45 as targets.
Comment: The RSI is bullish and calls for further advance. The validation of the ascending triangle calls for further upside.
