PRECIOUS METALS
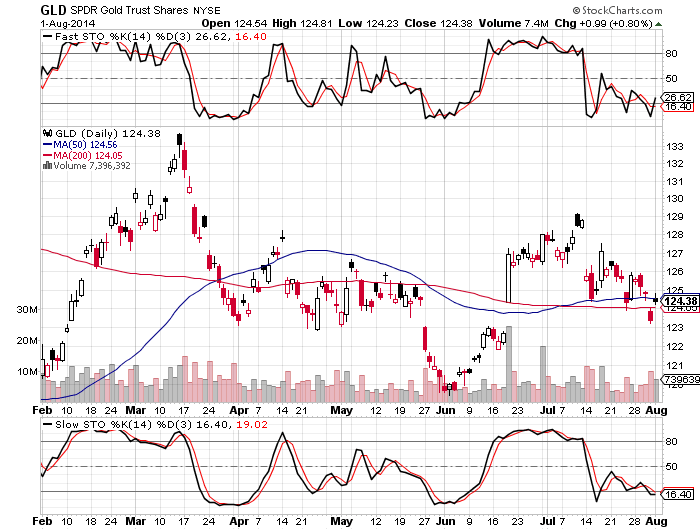
The 6-month SPDR Gold Trust (ARCA:GLD) chart below shows a bullish divergence and buy signal in the fast stochastic. There is no such divergence in the more important slow stochastic.
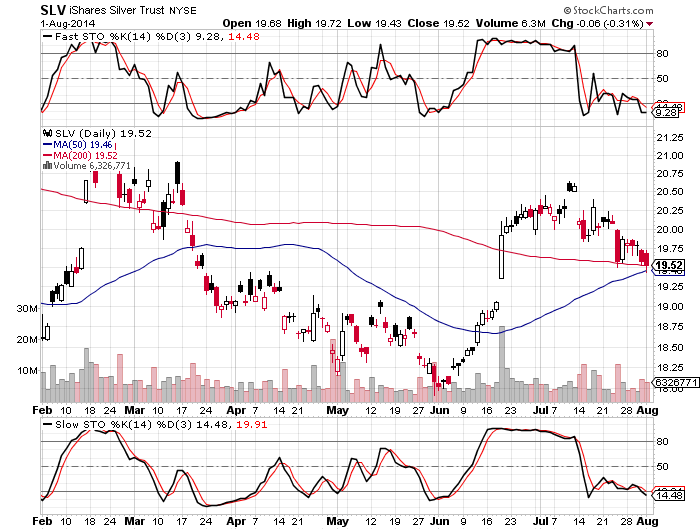
Following the GLD chart, we see the 6-month iShares Silver Trust (ARCA:SLV) chart, which stochastic contains no bullish divergence, in neither the slow nor fast stochastic.
On Thursday, the GLD broke its all-important and widely followed 200-day moving average. However, on Friday it closed in between the 200-day average and the slightly higher 50-day MA.
Short-term traders follow the latter moving average, with the most noted role for the 50-day MA being its crossing over the 200-day MA. The latter is known as a Golden cross, since it implies that the intermediate term is confirming the longer terms trend.

Witness the 6-month SLV chart below, and we see a Friday close right at the 200-day MA, only 6 cents above the 50-day MA.
Therefore, among other things, the SLV chart will reflect a Golden Cross (when 50-day MA cross the 200-day period) Monday or Tuesday in all likelihood, which is a much followed trading trigger.
Mark O'Byrne from July 31, 2014 GoldCore report:
''Silver has tested support at the 200 day simple moving average at $20.21 and has rebounded higher again. Below that there is support at the 50 and 200 daily moving averages at $20.19/oz and $19.99/oz respectively.''
Still, pattern-wise,the SLV ends up emulating the GLD chart with a break into the gap zone ~$19.30. It would be very common for silver's chart patternto emulate the GLD chart, right at the very end of a move.
So, given the GLD's action of Friday, it would be most common for silver to fall into the $19.30 - $19.40 area over the coming day or two, if it were going to do so.
This pattern (triple bottom, reverse shoulder-head-shoulder) and its accompanying technical indicators reflects an idealized pattern for a silver low, now,regardless how it plays out.
I am simply stating that if I were to draw a most ideal script from which silver would take-off, this would be it.
Primary 5-Wave advances for both metals, along with secondary 3-leg patterns indicate that the bottom has been seen, when further considering time cycles (all else notwithstanding).
In combination, the day is near for a blast-off. Any additional stalling would ultimately have no effect, as delays lower premiums, thereby providing an even greater spike and volatility swing. It will have all netted-out.
Volatility premiums are a key indicator of market apathy and complacency, which are typical of a an extreme. As well, it (CBOE Silver Etf Volatility) suggests what strategies to employ.
Anything is possible to extend a basing pattern, but the more it is stretched, the more volatility collapses and, with all of that, the most explosive risk/reward potential of any asset class is driven to the furthest recesses of insanity and irrational gain at the other end.
Remember: The irrational behaviour at a market's peak (or bottom) reflects the previously experienced insanity seen at the other extreme.

June 1, 2014
"The 5-year SLV chart on the next page depicts a triple-bottom over the past year, which can easily blast off once it breaks over and past the downtrend channel.
"According to how one would connect the chart points from 2011 to the present, that break occurs anywhere between $20.00 - $21.50, believe it or not.
Simply, taken in conjunction with the commentary above, the risk of an upward spike in silver is now extremely high.
However,...
The daily stochastic(below SLV price chart is) reflects what has often been a trend-followingpicture, which has offered few clues as to subsequent direction, EXCEPT for the fact that a bearish cross back of the stochastic under 80 after having crossed over it bullishly (above 80), has been superb at identifying a decline.
My last technical concern has been about the fact that the weekly stochastic, unlike the daily stochastic, has been a coincident indicator. This is a concern since the weekly indicator has turned negative (below 80). Note the 3-year SLV weekly chart .
This looks bad, however,
I analyzed some time ago that weekly stochastic tend to be coincident indicators during corrective countertrend moves, while more likely to be leading indicators during its primary 5-wave advances.
After analyzing the daily stochastic during the post May 2011 - present period (not shown), I have looked hard at the 2007 - 2011 weekly stochastic and found that the momentum indicator can peak months before an important top.
My theory is simple.:
Everyone knows that silver is a thin market. When there are heavy market pressures on the metal, regardless the source, silver's low liquidity means that it can be held down, implying therefore that it requires a great deal of momentum to lift the weight off.
Similarly, once the marketplace recognizes the trend to be bullish, it takes relatively little momentum to create much higher prices, due to the inferior volume (liquidity).
With the contradictory messages of the daily and weekly stochastic, one (bullish) scenario would be a 1- to 2-week bounce that has potential to $22.25, followed by a 3-week decline.
The latter would have potential to $20.25, which, in this scenario would be enough to correct the weekly stochastic to a level from which both of these stochastic indicators (daily and weekly) could launch to higher prices.
Either way, it is soon, or very soon.
July 6, 2014
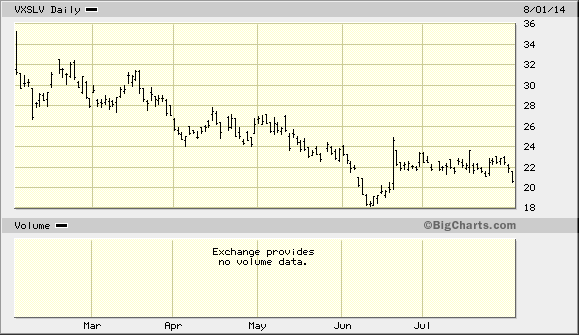
"This section-concluding 6-month CBOE Silver Etf Volatility chart (SLV option time premiums) offers a clue as to the next entry point, if another is provided.
"Simply, as opposed to being over-interested in the SLV itself, one can judge whether or not a higher low has been seen in silver by noting how the VXSLV is behaving.
"For instance, a test of the 20.5-levelin that index, should it occur, may be the best indicator off of which to play.
"The reasoning is simple: Option premiums gage psychology. If the latter is at a low, one need not consider the price action of the underlying security as much, since the "psychology level" that discounts the price low would have already been achieved."
The VXSLV low on Friday was 20.51.
June 1, 2014
"Recent reports and articles have plainly strategized the use of January 2016 SLV calls, new buyers' remaining 50% purchase of which should be completed by June 30."
Indeed.
July 6, 2014
"We may be watching a historical turning point in the early phases of acceleration."

10-Year Treasuries (iShares Barclays 20+ Year Treasury (ARCA:TLT)
As the 6-month TLT chart (Barclays 20+ year Treasury Bond Fund) below illustrates, fear is growing with a rush into US treasuries. The chart also shows:
July 6, 2014
"Bonds are overpriced, while PMs are underpriced. Market action will have reflected that reality through the second half of 2014."
Friday's candlestick-bullish outside day reversal maintained a trend of declines pausing at ever higher levels within its uptrend, as the marketplace's fear holds the upper hand.
For precious metals, this is a lead indicator, even more valuable than any asymmetric relationship with equities, however evident the latter has come to be.
Splitting hairs for some, the former is even more explainable fundamentally and politically, while the equity relationship is more based on correlation.
Please see the 1-year US Dollar Fund (PowerShares db USD Index Bullish (NYSE:UUP) chart below; it has come into resistance and the stochastic is lofty.
However, previous tops have occurred with divergences that were created with minor new highs!
July 6, 2014
"The Dollar does NOT need to head lower to support higher PM prices. That's yesterday's paradigm.
"Europe's easily forecasted printing spree will get the job done, as I discussed and illustrated early in the year when Draghi's intentions for the latter half of 2014 were made painfully obvious."
A falling Dollar is in no way necessary for a PM blast-off, though it could sure fuel it if it is occurring because the market abandons the idea that US bonds are a greater safe haven than PMs, which, as we know too well, requires a quadrillionth of what is invested in US bonds to take silver to $150 and $500 per ounce.
