The United States Federal government has zero debt.
This might sound untrue, bizarre, or even insane at first. You’ve seen all the scary charts about the US Federal debt load and it’s difficult to conceive of the idea that there’s something untrue or misleading about it. Yet, our Federal government does not have debt in a meaningful sense, and I will explain why.
The US Federal government is a sovereign issuer of its own currency. This makes it different from you and me, or even major American companies like Microsoft and Wal-Mart. It even makes it different from the state governments, like Missouri and California, as well as eurozone nations like Greece, Spain, and Italy. Since the United States can print its own currency, it cannot default unless it deliberately chooses to do so.
For this reason, even if we call US Treasury securities “debt,” they have very little in common with debt securities such as mortgages and corporate bonds. US Treasury securities have more in common with equity than debt.
While the US government might not have “debt” in a meaningful sense, that does not mean its fiscal decisions do not have a major impact on the economy. Since deficits create new money in our monetary system, that also means they create inflation. Inflation redistributes wealth across the economy, leading some to benefit substantially, while harming others even more so.
My goal in this article is to explain the US monetary system in a simple fashion, and also show which investments will benefit in various different scenarios. My view is that the US government, regardless of whether Barack Obama or Mitt Romney is President in 2013, will continue to exhibit an inflationary bias, making investments that thrive in that environment more ideal.
What is a US Treasury Security?
First off, however, we should ask the basis question, “if a US Treasury security is not debt, then what is it?” The most accurate way to describe a treasury security might be to call it “equity security with fixed common stock dividends.“
When you buy a US Treasury, the company you are investing in is the United States government, and by association, the US economy. This means that economic growth is important to Treasury security holders, but it’s not necessarily the most important aspect of the investment. Dilution is just as important. The more shares a company issues, the less valuable each share becomes.
To understand how US Treasury securities work, let’s envision a corporation that needs a cash infusion, and decides to raise equity capital. The equity shares they create are a bit atypical in that they guarantee a 3% dividend payment yearly, payable in common stock. The corporation is also free to issue stock at any time it likes with virtually no restrictions (i.e. no anti-dilution provisions).
In this scenario, while your return depends on many factors, there are two that are particularly vital. The first is growth of profitability. The more profitable the corporation becomes, and the more future growth is expected, then the higher market value of the company becomes. This results in a greater value for common stock holders.
The second important factor is stock issuance. The more stock the corporation issues, the less valuable each share becomes. Let’s run through a quick example.
Example
Let’s say we buy 100 shares of XZ Corporation at $1 each. There is a 5% common stock dividend paid at the end of the year. The total market value of the company is $1 million, and there are 1 million shares of stock outstanding.
The company’s first year is a massive success. The market value of the company increases to $1.2 million. Let’s say the company does not issue any equity during the year, but has to issue 50,000 more shares at the end of the year for its dividend payments. That means each share is now worth $1.14 and we now own 105 shares, rather than 100. Our total investment value increased from $100 to $120 [105 shares X $1.14].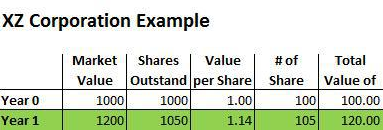
The company’s second year is a disappointment. The market value of the company falls to $1.1 million. The company issues no new equity during the year, but once again, needs to issue 5% more shares at the end of the year to pay its dividends. That brings the total of shares up to 1,102,500. Each share is now worth about $1 again, but our shares increased to 110.25, making our total investment worth $110.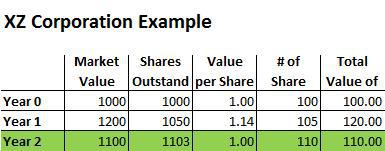
Dilution Example
Those two examples are straightforward enough, but the third year becomes more complicated. The company experiences phenomenal growth and the market value of the firm increases 25%, all the way to $1,375,000. Only problem is that in order to achieve that growth, the firm had to increase the share count by 50%, raising equity capital from outside parties. Once you factor that in, and the 5% common stock dividend, the number of shares increases to 1,736,438. The value of each share falls to 79 cents, and our number of shares increases to 115.75. This makes our total investment worth about $91.67.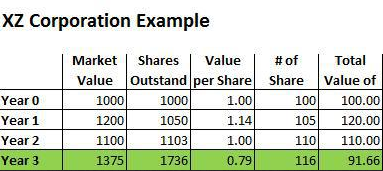
Notice that in spite of the phenomenal growth in Year 3, the overall value of our investment fell 16.7%! In fact, we lost more money in the “great year” (Year 3) than we did in the poor year (Year 2). This is why dilution is so important.
The scenario above is very similar to how US Treasury securities function. Your return is dependent upon economic growth (national profitability), as well as dilution (creation of new money).
The US Always Has a Balanced Budget
Now for our next radical proposition: the US government always has a balanced budget.
In accounting, there is a basic equation: Assets = Liabilities + Equity. With the US government, there is a similar equation: Expenditures = Taxes + New Money. “New Money” can also be thought of as inflation.
Even if the budget is not balanced in one sense of the world (i.e. expenditures being greater than taxes), it is balanced in another sense (i.e. “inflation tax” makes up the difference). The only problem is that we tend to ignore the inflationary part of the equation. When we talk about the budget, most people see this: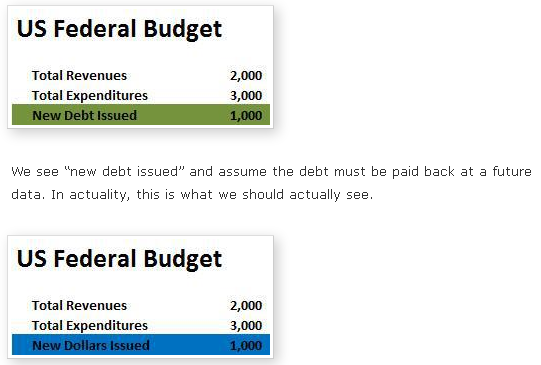
In the example above, there are $3 trillion worth of expenditures, but only $2 trillion in (explicit) taxes. This is balanced by $1 trillion in new money. This $1 trillion is an implicit tax and shows up in the US economy in the form of inflation.
So while the budget might not be “balanced” in the sense that direct taxes are lesser than expenditures, it becomes automatically balanced by the creation of new money.
Total Tax Burden = Total Spending
This leads to an important takeaway. The total tax burden is not the sum of “direct taxes.” Rather, the total tax burden for the US economy is actually equal to total government expenditures.
The chart below shows Federal expenditures as a percentage of GDP since 1948: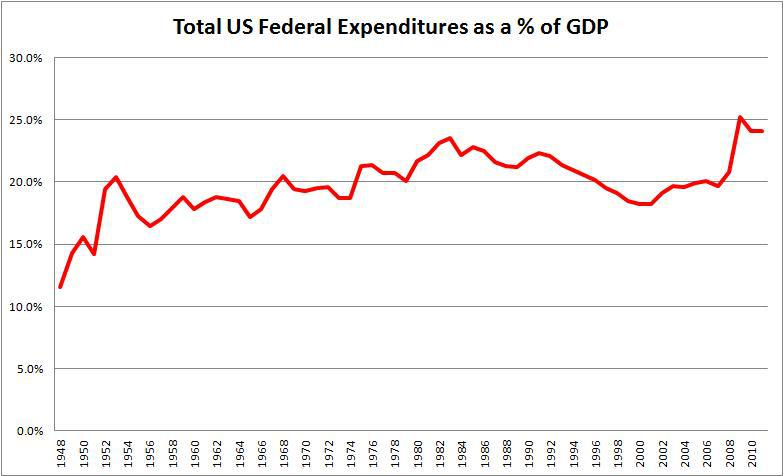
Based on this, over the past four years, we’ve had the highest Federal tax burden in the past century, with the exceptions of World War I and World War II. We can also view this showing the three major inputs:
- Explicit Taxes
- Inflation Tax (Budget Deficit)
- Total Tax Burden (Expenditures)
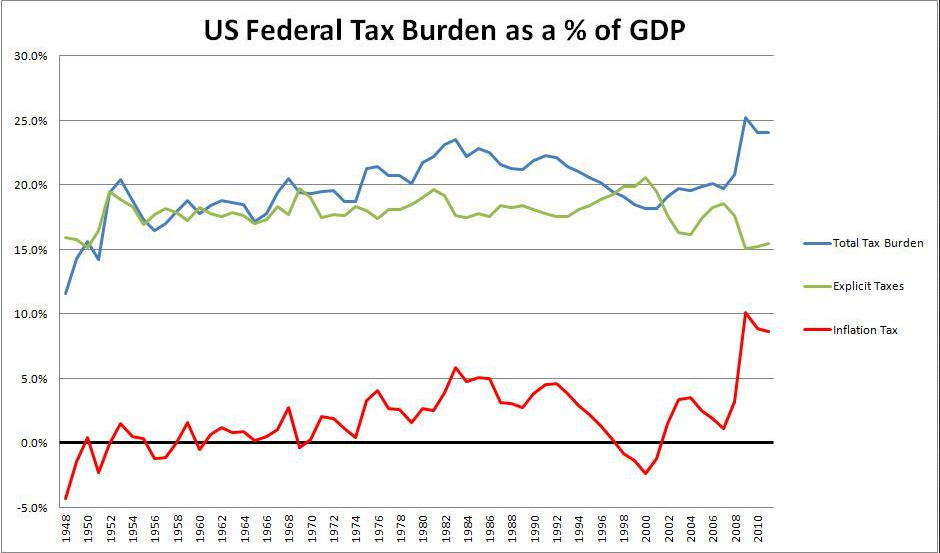
This chart makes it abundantly clear that while the explicit tax burden is slightly below the 65 year long-term average, the inflation tax burden is historically high.
The takeaway here is that in a monetary system similar to the one in the US, where a nation is a sovereign issuer of its own currency, explicit taxes, such as income and corporate taxes are only one part of the total tax burden. Whether we collected $4 trillion in tax revenues (and ran a $1 trillion budget surplus) or collected zero in tax revenues (running a massive $3 trillion budget deficit), the total tax burden would be exactly the same. The only difference would be in regards to who pays the burden, which is the next issue we will explore.
The Winners and the Losers, Part I
This brings us to our most important question: who are the winners and losers in this system? The answer to this question depends on a few factors. There are three basic budget dispositions that we should examine first off.
(1) Surplus. Direct tax revenues exceed expenditures. This results in monetary contraction. Investments that perform well in low-inflation and disinflationary environments will be the most optimal.
(2) Balance. Direct tax revenues equal expenditures. This results in no monetary change via fiscal policy.
(3) Deficit. Expenditures exceed direct tax revenues. This results in monetary inflation. Investments that perform well in high-inflation and growing inflation environments will be the most optimal.
Since a truly balanced budget (i.e. one where government direct taxes equal expenditures) does not create new money, we will consider that option neutral. Of course, degree is important here, too. A government deficit that is equal to 0.2% of GDP is not nearly as egregious as one that is 8% of GDP.
The chart below showcases some of the beneficiaries of deficit and surplus policies.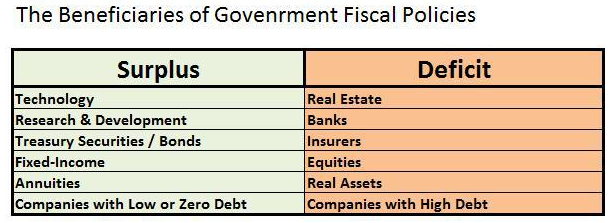
Some of these might be obvious, and some less so. Also, I’m being liberal with the term “beneficiary” in some cases. For instance, while real assets are typically the best investments in a rising inflation environment, that does not necessarily mean they “benefit” from fiscal deficits. Merely, that their real value is not adversely harmed by an increase in the money supply.
The less obvious ones might be the beneficiaries of the surplus policies. I’d argue that tech and R&D are big beneficiaries. In a sense, this is the inverse of real assets benefiting with inflationary policies.
Let’s say I invest in a start-up tech company that engages in a lot of R&D. This company likely has very little or no debt, and will possibly have to secure more rounds of equity funding to continue its research. Only problem is that with growing inflation, the initial investors lose out. Hence, we see fewer investors interested in R&D and we see companies that are already engaging in R&D as being more reluctant to seek more financing.
This situation is reversed with surplus policies that help strengthen the US dollar. New rounds of funding are not nearly as dilutive, and therefore, companies are more likely to seek out more capital.
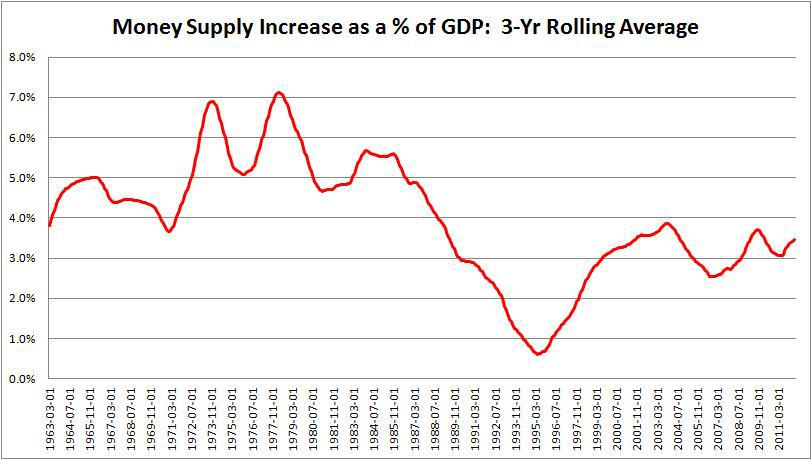
Not coincidentally, the tech boom occurred in a time of low inflation and government surpluses. Indeed, in a prior article I authored on housing market improvement, I created the two charts below. The first shows the difference between M2 moneys supply growth and nominal GDP. The second shows M2 money supply growth as a 3 year average.
Notice that the early and mid 90s form the lowest points on both charts, showing extremely low money supply growth that was far outpaced by GDP growth. Technology and R&D booms may be more likely to occur in that sort of environment.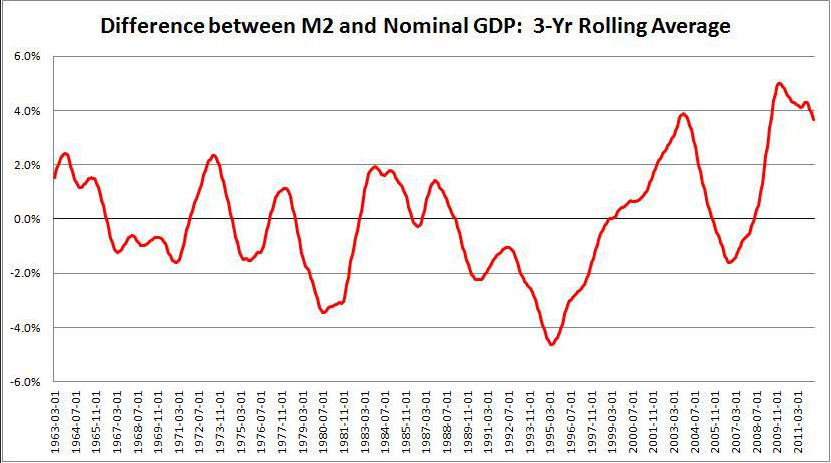
For this same reason, companies with low/zero debt are beneficiaries in a surplus environment, as well. Companies with high debt benefit from deficit environments, because their debts are partly devalued. Whereas, in a surplus environment, companies with high debts actually see their debts increase in real terms.
Banks and insurers benefit from deficit environments, because they are essentially high-debt companies. Banks may lend out money, but they do so by borrowing first.
The Winners and Losers, Part 2
There is of course, a second part of the equation here. By examining surplus and deficit policies, we are looking at which investments benefit with monetary contraction/stability versus monetary expansion. However, direct tax burden is also important. Unfortunately, it’s difficult to create quite as neat of a chart for this one, given the vast multitude of options. Instead, we’ll simply look at a few scenarios that have been proposed by both major Presidential candidates, and examine who the winners and losers might be.
Simplified tax code. Biggest winner would be the American economy. The Laffer Center estimates that tax complexity costs $431 billion annually. To put this in perspective, this is roughly equal to about 2.9% of the entire US economy. Mitt Romney’s tax scheme would appear to simplify the tax code to some extent, but it’s unclear how much this will be the case.
The biggest losers here would be companies like H&R Block (HRB), Jackson-Hewitt, and tax lawyers. Homebuilders, real estate, and financial institutions might also be losers in one sense, since the mortgage tax deduction might get chopped in this proposal, but this might be partly offset by a general economic boost.
Higher income taxes. Biggest winner might be companies that benefit from tax deductions and exemptions. This would include homebuilders (XLB). The biggest loser would be the American economy. With higher income taxes, economic growth would fall.
Higher investment taxes. Investment taxes are similar to income taxes, except whereas income taxes have a more general affect, investment taxes will certainly hamper investment more severely. Since investment is the primary way jobs are created, this will likely result in higher unemployment and weaker economic growth.
Obamacare. Medical device companies are the biggest losers under Obamacare, as there will be a 2.3% tax imposed on medical devices. However, Obamacare also includes a host of other taxes increases, including a 3.8% investment tax (capital gains and dividends).
Higher defense spending/cuts to other programs. This one is somewhat obvious, but the biggest beneficiaries of higher defense spending would be defense contractors, such as Lockheed Martin and General Dynamics. This is a Romney proposal and it would seem to come with cuts in some miscellaneous programs, so difficult to pinpoint which investments might be harmed.
However, coupled with Romney’s other proposals, I would suggest that this will benefit defense contractors, but harm homebuilders, real estate, and possibly companies with high debt. My reason for saying this is that these seem like idea areas to simplify that tax code.
Fiscal cliff. If we were to take the “fiscal cliff” route, we would actually still have a deficit, so some of the gloom-and-doom proclamations are exaggerated. However, this route will hit defense spending particularly hard, and will also result in significantly higher income and investment taxes.
However, the inflation tax (i.e. fiscal deficit) would be reduced. Since this options lower spending (and hence total tax burden), it might be beneficial in one sense, but it would come at the expense of employment, with significant investment tax increases.
Conclusions
The mainstream view on government fiscal policies is not wholly incorrect, but could use significant refinement. It’s a mistake to view US government Treasurys as “debt,” because they more closely resemble hybrid equity securities. Budget deficits don’t result in greater debt, but rather a higher inflationary tax burden. Budget surpluses don’t lower the debt, but rather create disinflation.
The total tax burden is equal to total expenditures. Direct taxes are meaningless to the total tax burden (which is direct taxes + indirect taxes), but they do determine how that tax burden is allocated. It’s vital to understand this in order to truly understand how investment will be impacted by policy decisions.
From watching the Presidential campaign unfold, my view is that both Barack Obama and Mitt Romney will continue the indirect inflation tax. Obama has consistently favored increasing spending. While Romney has talked about deficit reduction, he has also talked about increasing military spending, so it’s unclear to me that he would eliminate the deficit either. My guess is that the inflation tax will remain higher under Obama than Romney, but maybe not by much.
On top of continuing the inflation tax, President Obama is likely to implement new investment and income taxes, as well. Mitt Romney appears likely to continue the large inflation tax, but less likely to impose new investment and income taxes.
Based on the continued likelihood of new money creation via Federal budget deficits, I believe that real estate, banks, and insurers will benefit regardless of who is President in 2013. Defense contractors and capital investment will benefit more under Romney. Real assets, and high-debt companies are more likely to benefit under Obama.
