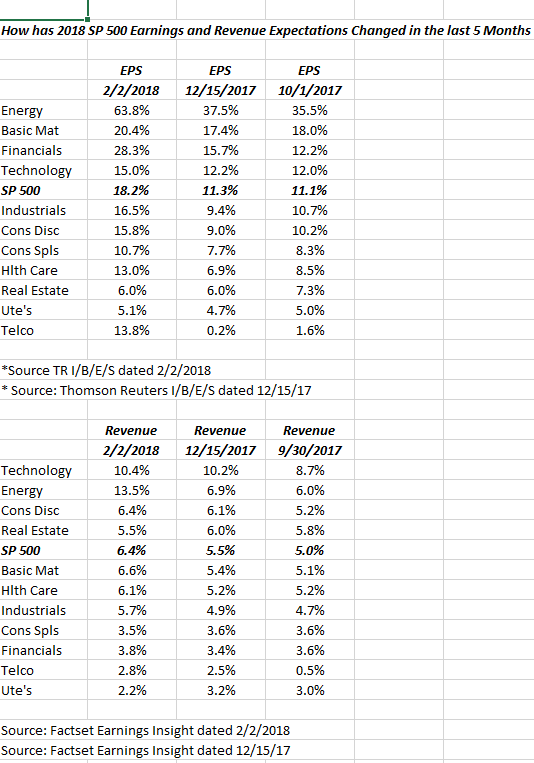
This blog post (see link) was written last December, 2017, and given tax reform and the hefty 6% return for the SP 500 in January, 2018, I thought a refresher might be in order.
Since Thomson doesn’t publish annual revenue estimates, Factset’s revenue estimates are used, although the expected EPS growth for 2018 is Thomson Reuters I/B/E/S data.
A couple of trends jumped out:
1.) Exxon (NYSE:XOM) and Chevron (NYSE:CVX) had tough days on Friday, after their earnings reports but Energy is still expected to show robust earnings growth in 2018. It will be interesting to see if Energy sector estimates change in the next few weeks. Clients own no Energy in their portfolio’s. (None).
2.) Financial sector EPS growth has nearly doubled since mid-December ’17. Wells Fargo’s news could take a little steam out of that next week, but I still think that Financial’s are one of the best sectors to be invested in, in 2018.
3.) Technology has been less robust, in terms of upward revisions. Expected revenue growth for the sector hasn’t budged since December ’17 while EPS growth has been revised higher, understandable given the substantial cash positions, but still investors are seeing better revisions in sectors like Financials, Basic Materials, etc.
4.) Basic Materials: just 3% of the S&P 500 and a lot of that is Chemicals. Chemical companies – from eyeballing the Materials Select Sector SPDR (NYSE:XLB) ETF – make up 50% of the XLB. Freeport-McMoran Copper & Gold Inc (NYSE:FCX) is the 9th largest position in the XLB and is 3.85% of the ETF as of Friday’s close (per Morningstar). The iShares US Basic Materials (NYSE:IYM) or Basic materials ETF is almost an identical portfolio from looking at it quickly,and again Freeport is the 9th largest position at 3.9% of the ETF.
5.) Industrial sector earnings have seen a nice ramp since mid-December ’17,up over 50%, surprising since General Electric Company (NYSE:GE) is still in the sector. GE’s weight in the Industrial ETf’s has declined to where it is now 8th or 9th in the XLI but still 3rd in terms of weighting in the iShares iShares US Industrials (NYSE:IYJ).
If 2018 turns out to be a “1994” type year, where rising rates suppress equity valuations and the stock market winds up fighting the bond market headwind, Cyclical stocks, Industrial’s, Basic Materials, those sectors will tend to be least sensitive to the bond market.
Here was the 2018 equity market forecast and also here was the 2018 bond market forecast both compiled in mid-December ’17.
Financial stocks have been added to and the weighting lifted in the Finance sector and Tech’s weighting has been reduced but still overweight to market-weight. Cyclicals will likely be added to on any pullback.
It’s still early in 2018, but its looking like a 1994-type year.
Thanks for reading and thank you to “greyheli”, a Seeking Alpha reader for the prompt.
