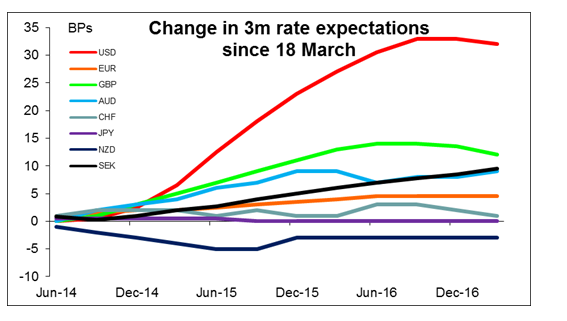
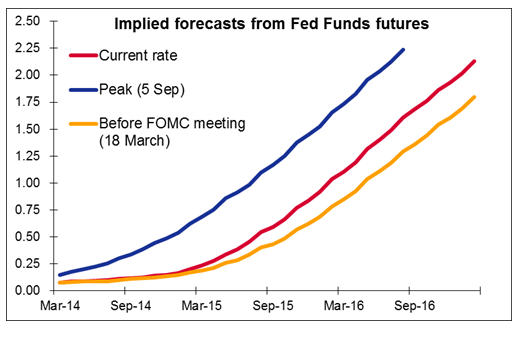
US interest rate expectations continue to edge higher post-FOMC, but the dollar is losing ground nonetheless as fears over Ukraine recede and short-term rates in many other countries rise as well, albeit not by as much as they have in the US. The implied interest rates on Fed Funds futures continued to move higher, as did 5-year yields (although 10yr Treasury yields are below their post-FOMC highs). Fears of higher policy rates seem to be affecting US stocks and gold, which declined, yet the dollar isn’t getting much support. Worries about Ukraine are receding as US Secretary of State Kerry holds meetings with his Russian and Ukrainian counterparts and a survey of Germans showed a majority think the West should accept Russia’s annexation of Crimea.
As a result, the dollar is opening lower this morning against most of the currencies that we track. Copper and oil are the biggest gainers as risk sentiment returns and Chinese stocks rallied, while among currencies, AUD, NOK and CAD are doing the best among the G10 currencies and ZAR, RUB and INR have followed CNY higher in the EM world. CNY rose to a one-week high after the central bank raised the currency’s fixing for a second day in a row, which countered much of the negative sentiment from yesterday’s lower-than-expected HSBC China manufacturing PMI. It seems to me that risk appetite is on once again and unless and until either the Ukraine situation heats up again or people get more concerned about Chinese growth, we can expect the commodity currencies to continue to gain, contrary to what I had expected.
The main event on the agenda today will be the German Ifo survey for March. The business climate index and expectations index are forecast to have declined, while the current assessment index is expected to be up slightly. Last month, all three indices came out better than anticipated with EUR/USD rising about 20 pips at the time of the release.
From the UK, the nation’s CPI is expected to have risen 0.5% mom in February vs -0.6% mom in January, driving the yoy rate down to 1.7% from 1.9%. BBA mortgage approvals for February are expected at 50000, not much of a change from 49972 in January.
In the US, the Federal Housing Finance Agency (FHFA) house price index and the S&P/Case-Shiller home price index for January are expected to show a slowdown in the pace of increase in house prices. New home sales are expected to have declined in February, after rising in January. The Conference Board consumer confidence index for March is expected to have risen to 78.5 from 78.1 in February, while the Richmond Fed manufacturing survey for the same month is expected to be up to 4 from -6. This mix of indicators is overall slightly US-positive, although sentiment may prove stronger than facts in determining the course of the currency.
Two speakers are scheduled on Tuesday. ECB President Mario Draghi and Atlanta Fed President Dennis Lockhart.
The Market
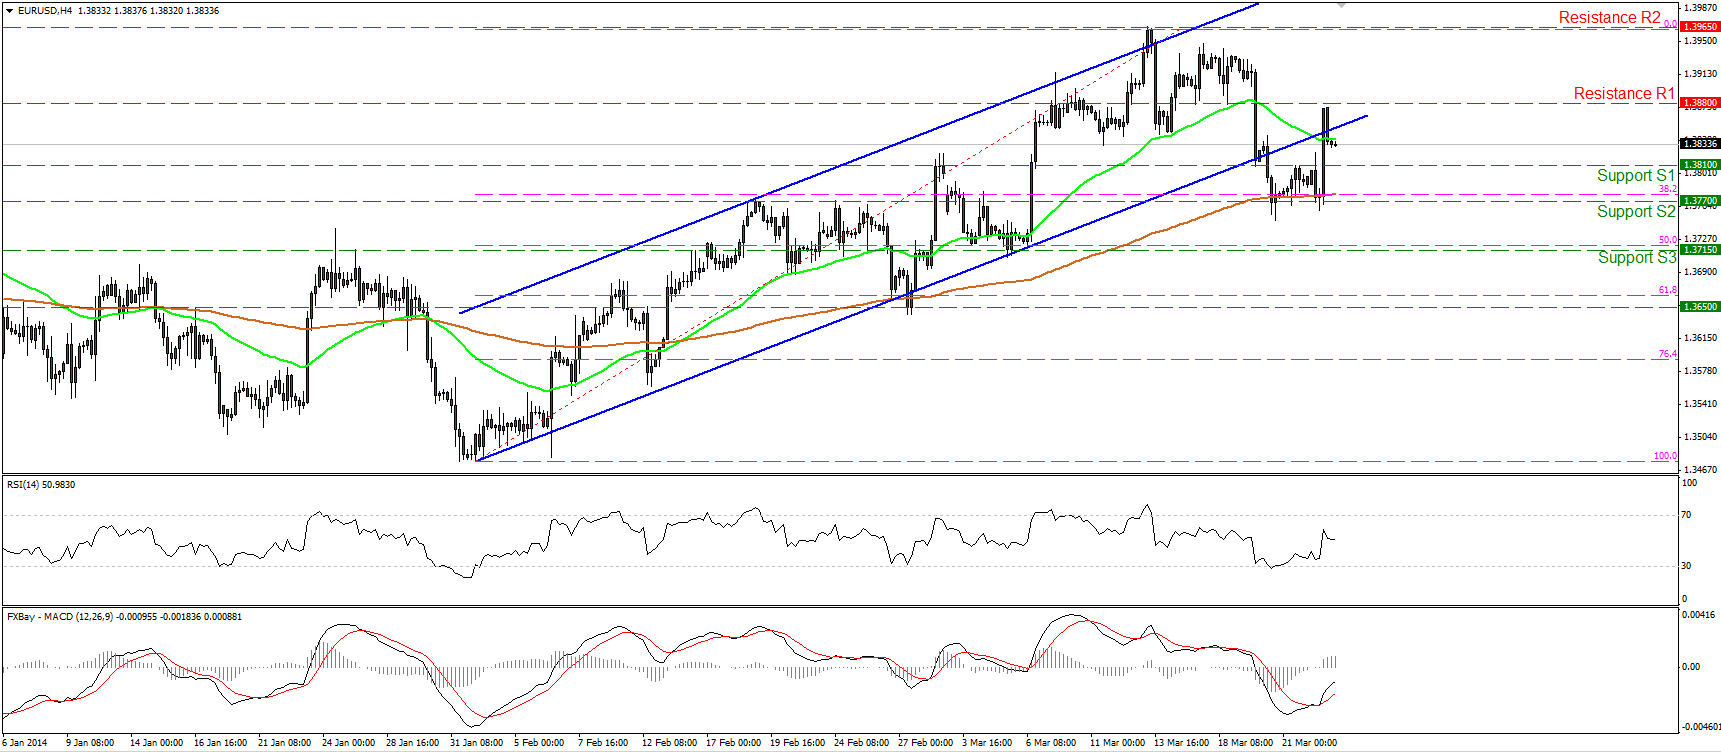
The EUR/USD moved significantly higher on Monday and tried to reenter in the upward sloping channel. But after finding resistance near the 1.3880 barrier, it moved lower to settle once again below the lower band. I adopt a neutral stance for now, since a break below the support of 1.3770 (S2) and the 200-period moving average is needed to confirm a forthcoming lower low. On the other hand, a break above the highs of 1.3965 (R2) may confirm that the recent decline was just a 38.2% retracement of the 3rd Feb. – 13th Mar. short-term uptrend.
Support: 1.3810 (S1), 1.3770 (S2), 1.3715 (S3).
Resistance: 1.3880 (R1), 1.3965 (R2), 1.4000 (R3).
USD/JPY
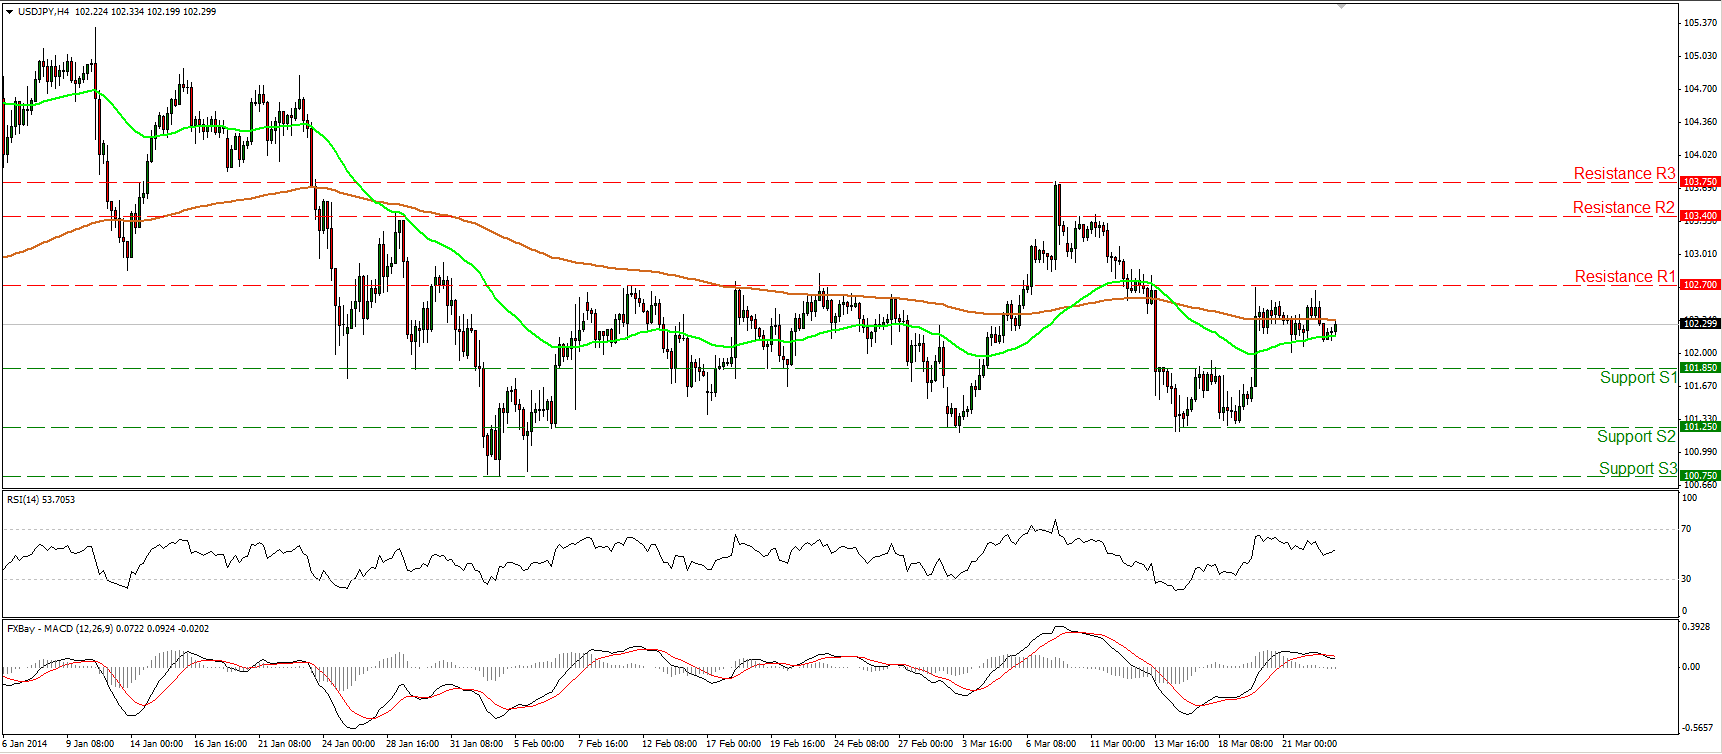
The USD/JPY moved in a consolidative mode, remaining below the resistance of 102.70 (R1). A clear break above the 102.70 (R1) hurdle may target the next one at 103.40 (R2). Nonetheless, since the pair is not in a clear trending phase, I consider the overall outlook to remain neutral. Both the moving averages are pointing sideways, while on the daily chart, both the daily MACD and the daily RSI lie near their neutral levels, confirming the sideways path of the currency pair.
Support: 101.85 (S1), 101.25 (S2), 100.75 (S3).
Resistance: 102.70 (R1), 103.40 (R2), 103.75 (R3).
EUR/GBP
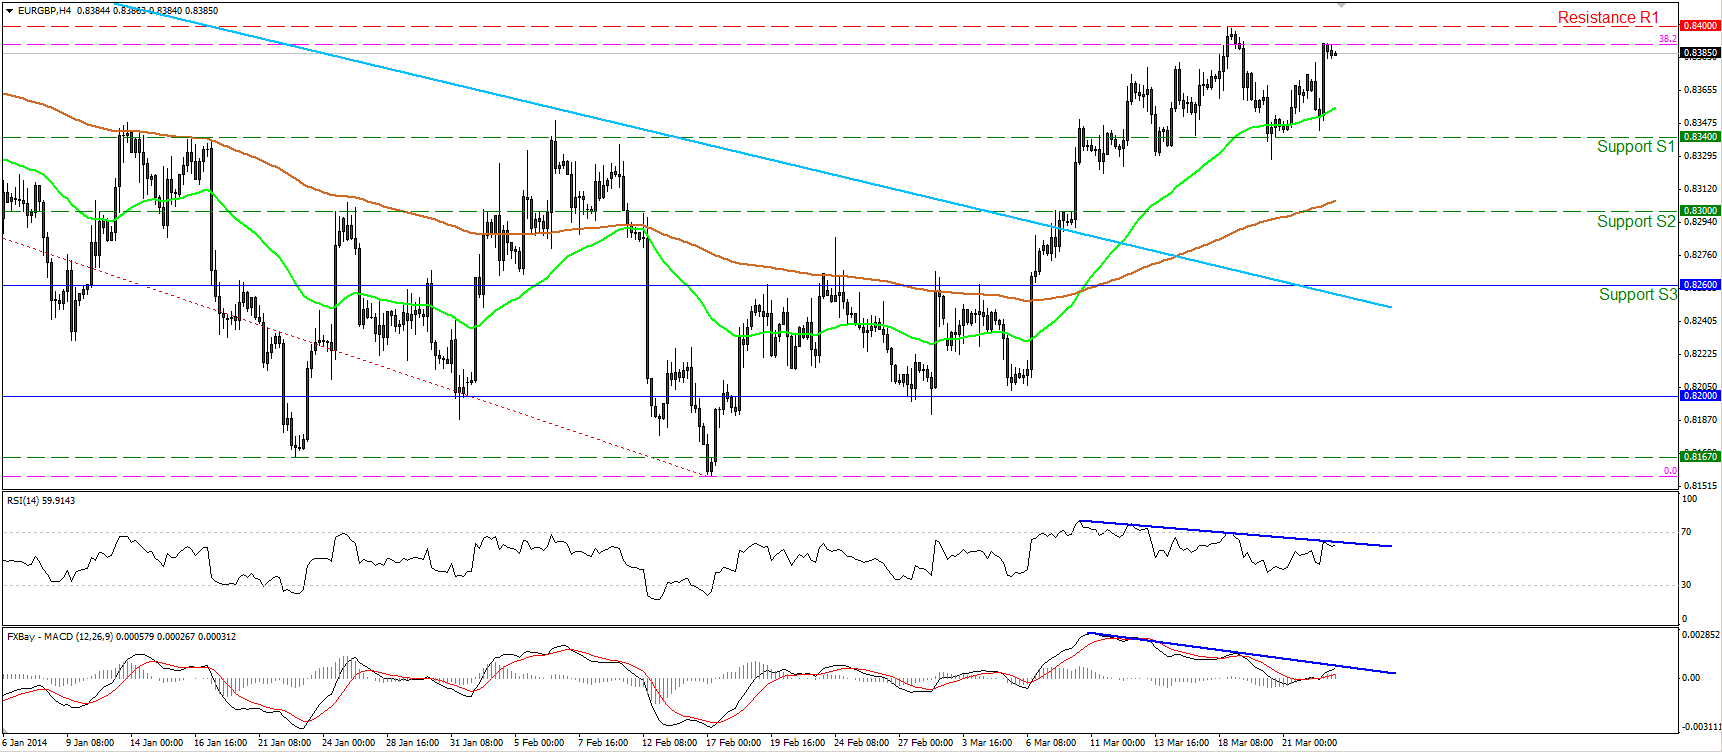
The EUR/GBP moved higher after rebounding near the 50-period moving average and is now trading slightly below the 0.8400 resistance barrier. A break above that level may have larger bullish implications and target the next resistance at 0.8460 (R2), which coincides with the 50% retracement of the 1st Aug. - 17th Feb. downtrend. My only concern is that we can identify negative divergence between both our momentum indicators and the price action, signaling that the upside momentum is decelerating, for now.
Support: 0.8340 (S1), 0.8300 (S2), 0.8260 (S3).
Resistance: 0.8400 (R1), 0.8460 (R2), 0.8535 (R3).
Gold
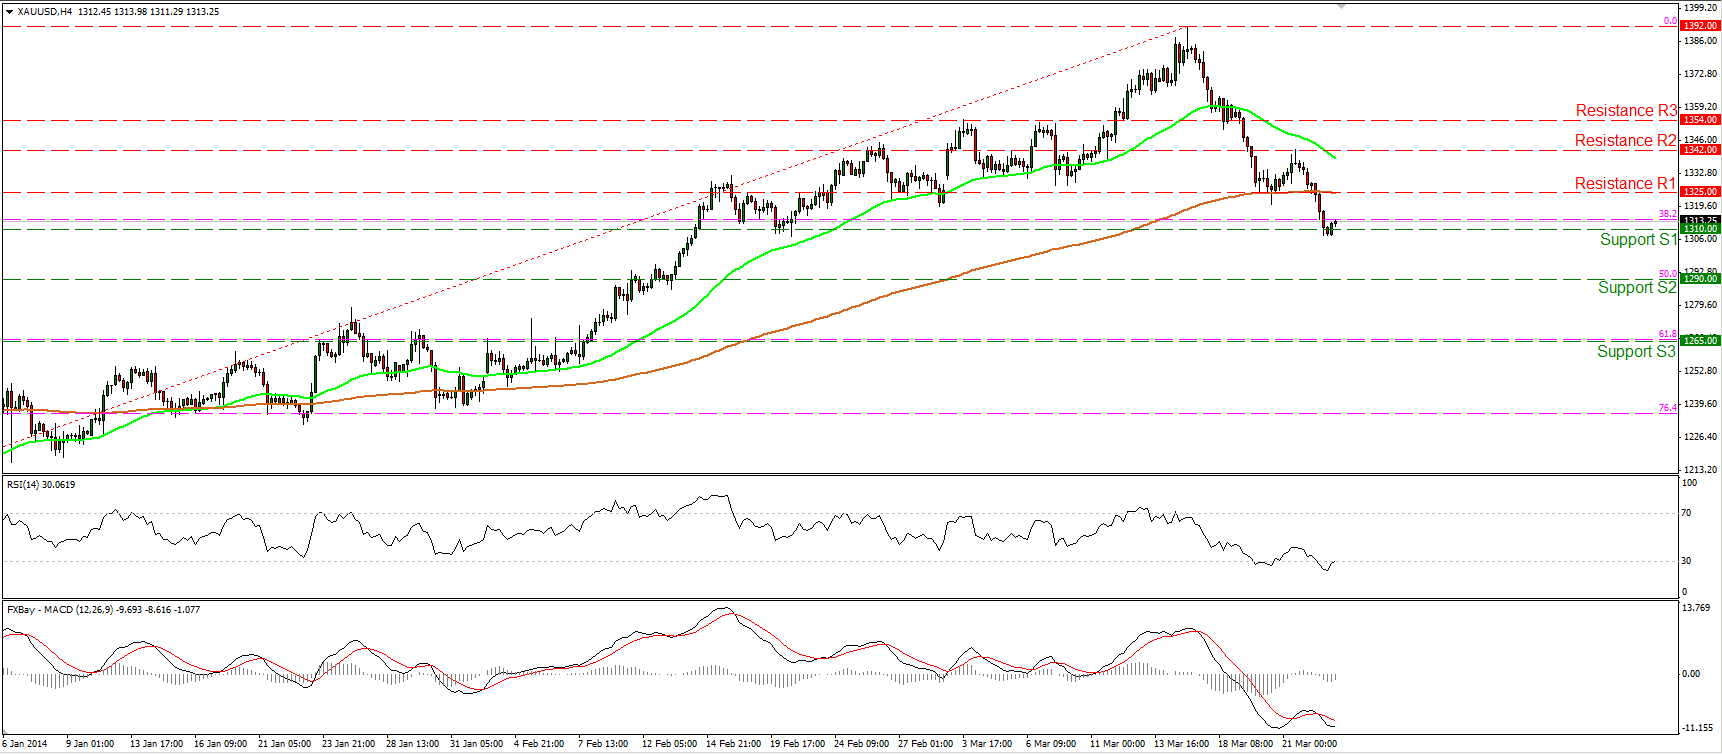
Gold fell below the 1325 barrier and reached the support level of 1310 (S1). A decisive dip below that support may pave the way towards the 1290 (S2) bar, which coincides with the 50% retracement level of the 20th Dec. - 14th Mar. advance. The RSI seems ready to exit oversold conditions, thus an upward corrective wave before the bears prevail again cannot be ruled out.
Support: 1310 (S1), 1290 (S2), 1265 (S3).
Resistance: 1325 (R1), 1342 (R2), 1354 (R3).
Crude Oil
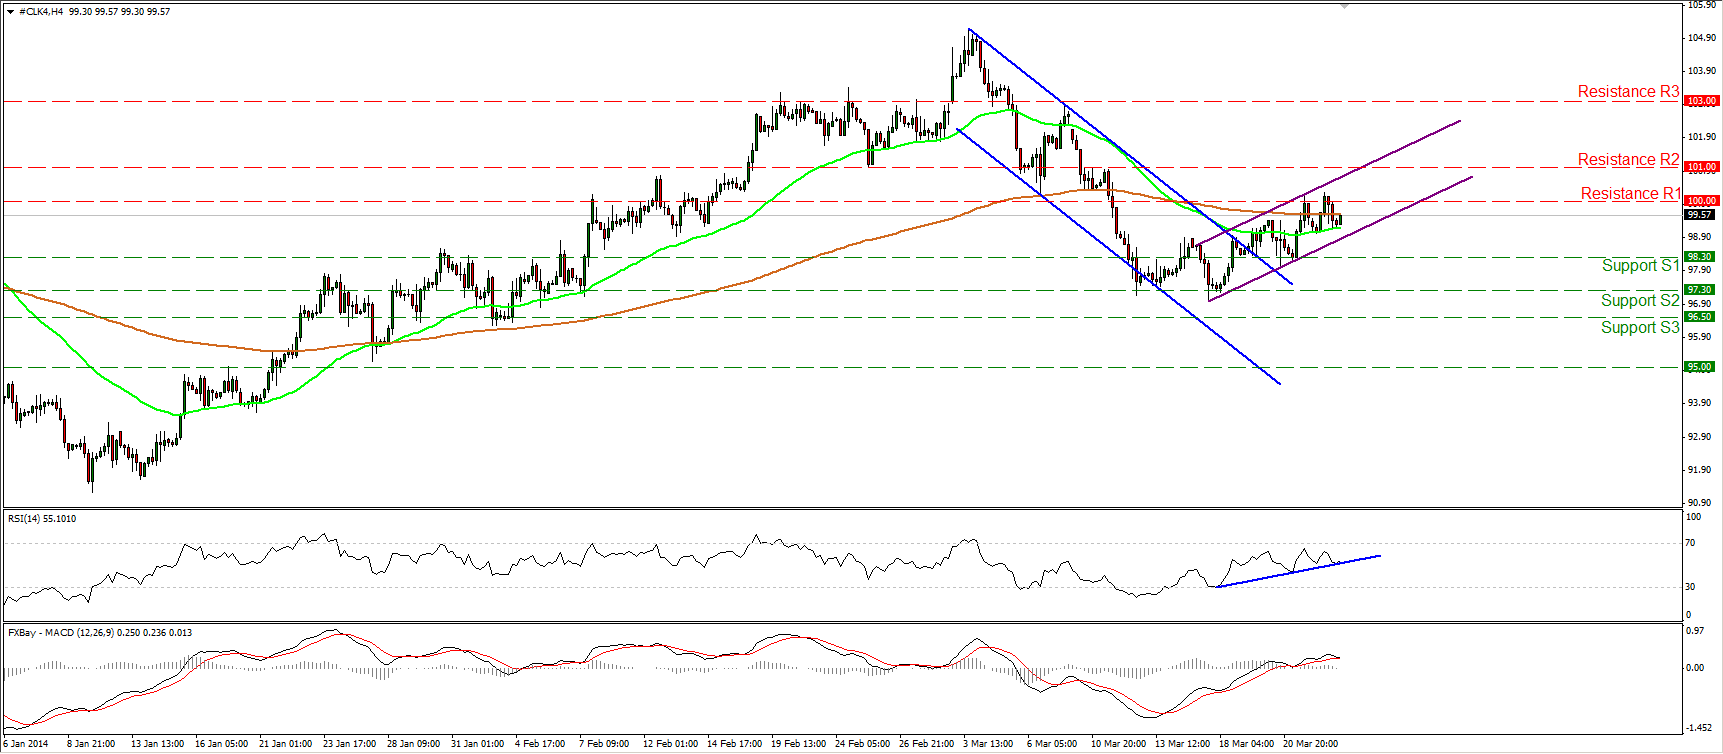
WTI failed once again to break above the resistance of 100.00 (R1). However, the price remains within the purple upward sloping channel and a break above 100.00 (R1) may challenge the next resistance at 101.00 (R2). Only a break below the 98.30 (S1) support may indicate the recent advance has ended. Relying on our momentum studies does not seem a solid strategy for now, since the RSI met support at its blue support line, while the MACD seems ready to cross below its signal line.
Support: 98.30 (S1), 97.30 (S2), 96.50 (S3).
Resistance: 100.00 (R1), 101.00 (R2), 103.00 (R3).
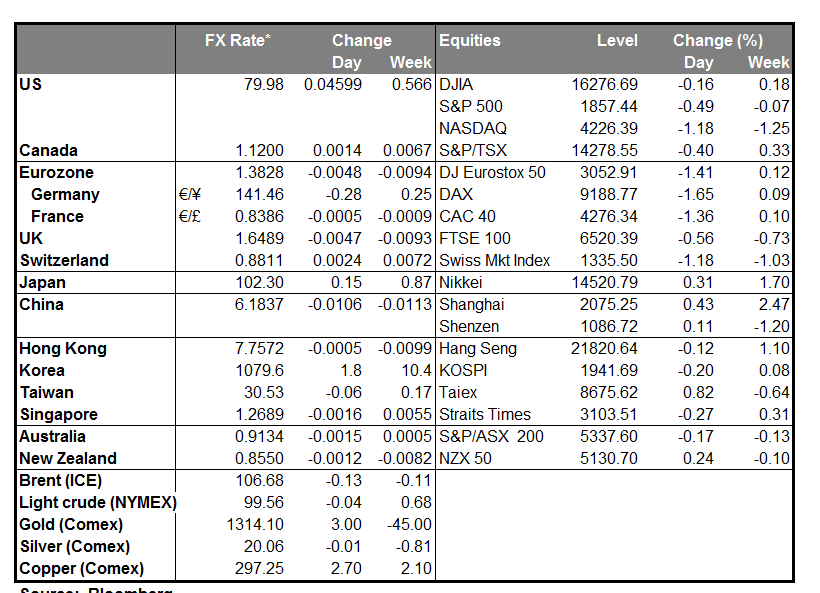
BENCHMARK CURRENCY RATES - DAILY GAINERS AND LOSERS
MARKETS SUMMARY
Disclaimer: This information is not considered as investment advice or investment recommendation but instead a marketing communication. This material has not been prepared in accordance with legal requirements designed to promote the independence of investment research, and that it is not subject to any prohibition on dealing ahead of the dissemination of investment research. IronFX may act as principal (i.e. the counterparty) when executing clients’ orders. This material is just the personal opinion of the author(s) and client’s investment objective and risks tolerance have not been considered. IronFX is not responsible for any loss arising from any information herein contained. Past performance does not guarantee or predict any future performance. Redistribution of this material is strictly prohibited.
Forex and CFDs are leveraged products and involves a high level of risk. It is possible to lose all your capital. These products may not be suitable for everyone and you should ensure that you understand the risks involved. Seek independent advice if necessary. IronFx Financial Services Limited is authorised and regulated by CySEC (Licence no. 125/10). IronFX UK Limited is authorised and regulated by FCA (Registration no. 585561). IronFX (Australia) Pty Ltd is authorized and regulated by ASIC (AFSL no. 417482)

