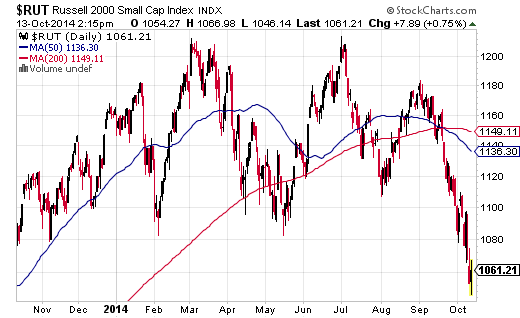
Since October of 2011, the US. stock market has not only been resilient, it has repelled more water than Gore-Tex. The pullbacks in 2012, 2013 and the first eight months of 2014 have been unrepentant buying opportunities.
The current downpour that began in mid-September, however, has presented bears with more compelling reasons to sell. Market valuations are higher than they were three years ago. The global economy is weakening in ways that had not been present in earlier years. And, here in October 2014, the U.S. Federal Reserve is terminating its electronic money creation/bond-buying stimulus.
Investors should be able to recall that the quantitative easing bailouts (i.e., QE1, QE2, QE3) reinvigorated risk-taking at the bear market bottom of 2009, at the lows of the 16% correction in 2010 as well as at the depths of the 19%-plus decline in 2011. And without the prospect of the Fed stepping forward to bolster confidence – without clear evidence that chairwoman Janet Yellen plans to leave zero interest rate policy in place for a much longer time in 2015 – investor skittishness is likely to inflate dramatically. (They might like wages and household income to inflate to show the effectiveness of their policies, but the Federal Reserve has not seen that at any time in the recovery so far.)
Perma-bulls might be surprised to discover that purchasing stocks when they pull back 5% from all-time highs is “different” this time. Specifically, out-of-whack fundamental ratios (e.g., price-to-book, price-to-sales, price-to-earnings, etc.) inevitably return to historical norms, demonstrating that this time is NOT different. Small-cap U.S. stocks in the Russell 2000 hitting new 52-week lows show that this time is NOT different. And safety seekers craving long-term Treasuries – pushing them to new 52 week highs – prove that this time is NOT different. Simply put, perma-bulls may actually see that the stock market does not go up indefinitely.

Assume for the moment that the stock market has been terrible for an entire month. For small- and mid-sized corporate shares, it might be longer than that; for large-caps, the media had been hyping the all-time records on September 18. Regardless, it is fair to say that things have been rather torturous on a month-over-month basis. What might one have done to alleviate some of the pain? What types of assets could have hedged concerns that you may have had going into September?
Below are several ETFs that I often use to hedge against stock risk. I am providing month-over-month returns as well as corresponding 3-year correlations with Vanguard Total Market (VTI):
| Month-Over-Month Returns And Correlation Data | |||||||
| MOM % | 3 Yr Corr | ||||||
| (W/ VTI) | |||||||
| 9.9% | -0.50 | |||||
| 3.8% | -0.44 | |||||
| 0.1% | -0.29 | |||||
| 0.1% | -0.02 | |||||
| -2.1% | 0.11 | |||||
| -5.4% | NA | |||||
Indeed, if a correction is in the works, one might be advised to incorporate negatively correlated assets into his/her portfolio. Funds like Vanguard Extended Duration Treasury (EDV), iShares 10-20 Year Treasury and the Japanese Yen Trust (FXY) have negative correlations with Vanguard Total Market (VTI), providing an effective hedge against an ongoing erosion of stock price. Similarly, the Currency Shares Swiss Franc (FXF) and SPDR Gold (GLD) are non-correlated assets that have been marching to the beat of their own respective drums. While neither has made much headway in the month-over-month blood-letting for stocks, neither has depreciated as much in value as VTI.
It is hardly too late to hedge against a much larger correction for stock assets. Any of the above-mentioned five ETFs can be added to a portfolio to diversify, though an effective hedge might best be accomplished through the use of a “barbell” or a “multi-asset approach.” One can implement the barbell portfolio that I have been talking about since the beginning of the year. For simplicity sake, a barbell portfolio might involve long-maturity Treasuries like (NYSE:TLH) and EDV in combination with large cap-oriented ETFs such as VTI and iShares S&P 100 (NYSE:OEF).
The other consideration? Make room in the portfolio for more than Treasuries alone when hedging against stock risk. Consider the possibility of adding the Japanese yen, the Swiss franc and the yellow metal a la SPDR Gold (GLD). A multi-asset stock hedge coupled with three or four low-cost stock index ETFs is highly likely to reduce volatility as well as loss. By the same token, one is highly likely to achieve similar-risk reducing results with cash – cash raised by stop-limit loss orders.
