History repeats itself — although most often with slightly different twists
Price graphs have provided strong clues to the direction of gold and Crude Oil in recent years. So the question is what’s next?
Crude Oil summary
In August 2014 — with Crude Oil prices near $100 — this blog and the Factor email service began predicting a collapse in energy prices. This prediction was based on the formation of a symmetrical triangle pattern. We had been monitoring this triangle for more than a year. Read our August 2014 analysis here. The Factor initially projected a decline in Crude Oil to $65 — this target was then lowered to $45. Crude Oil producers scoffed at these forecasts. Crude Oil futures reached $44.20 on Jan 12, 2015.
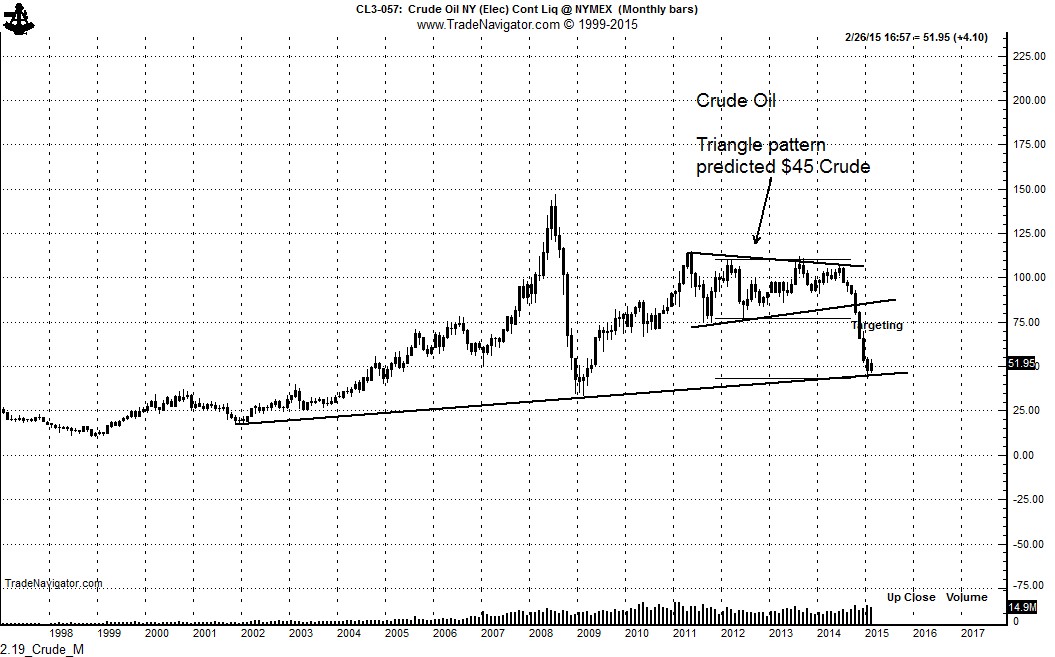
The talking heads on CNBC and Bloomberg have now declared an end to the Crude Oil bear market. But, has Crude Oil bottomed? Should traders rush out and buy Crude Oil futures or related ETFs. I think not!
Let history be your guide
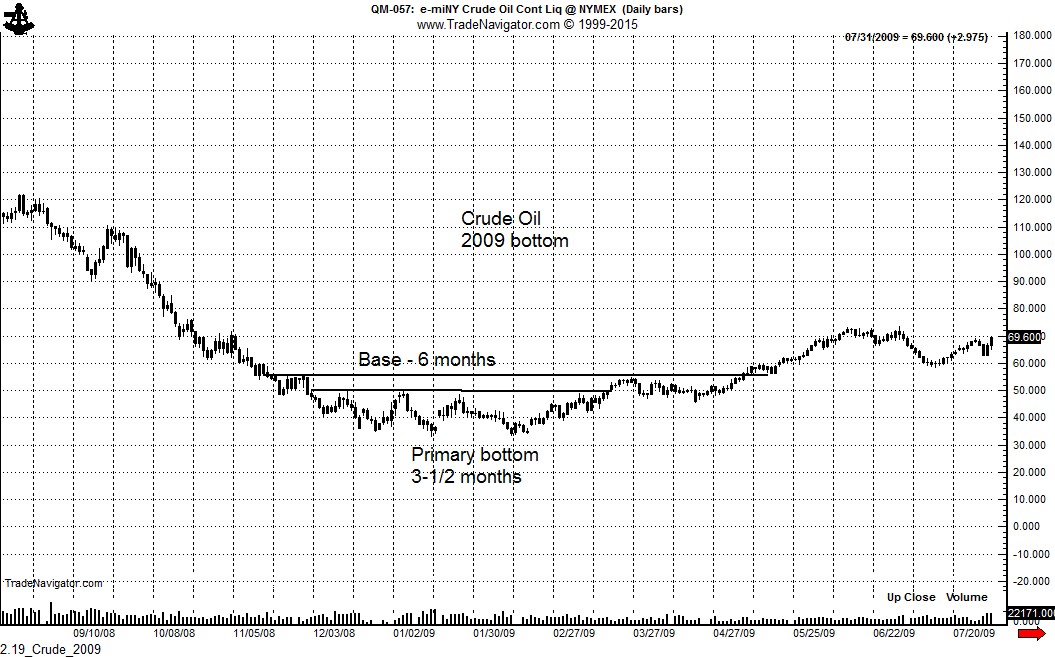
After the decline from $147 to $32.48 in 2008 (that’s right — a $114 decline), Crude Oil spent six months building a bottom on the nearby futures contract chart, as shown below. SIX MONTHS! The absolute low-to-date in this current Crude Oil bear trend occurred on Jan 29, only three weeks ago.
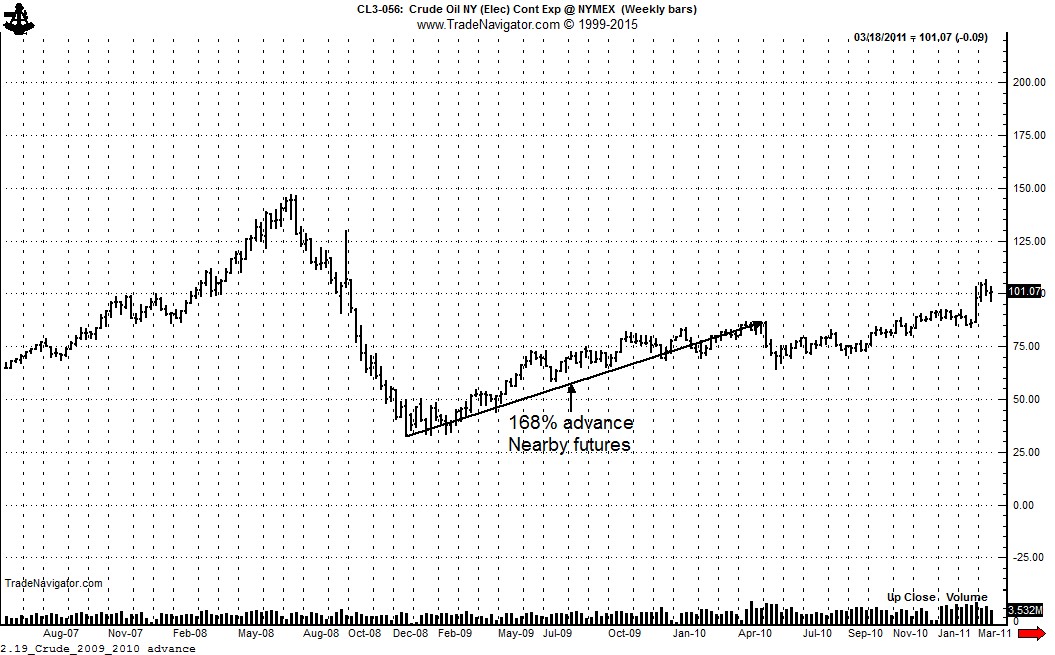
There is more to the story on why it is too early to become a Crude Oil bull. After the $114 decline in 2008, Crude Oil futures (nearby contract) advanced 168% from the Dec 19, 2008 low to the May 9, 2010 high, as shown below.
Yet, enormous carrying charges developed during the 2008 decline. From Dec 19, 2008 (low for nearby Crude futures) through May 2010, the June 2010 Crude Oil futures advanced only 17% as shown below.
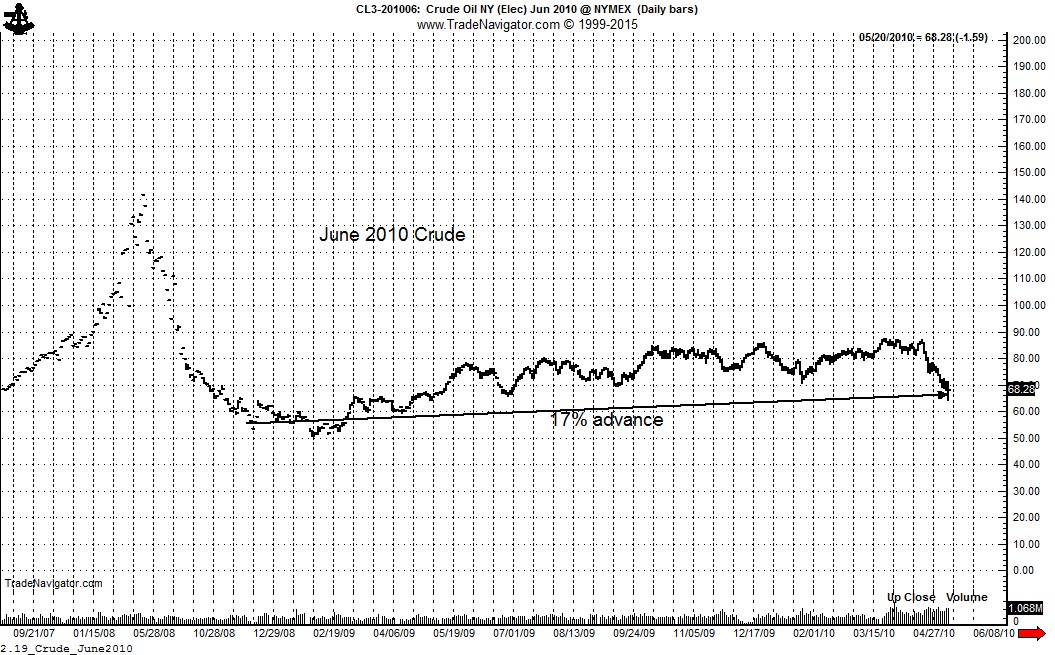
Crude Oil ETFs did not do any better. If a trader bought the ETF (NYSE:OIL) on Dec 19, 2008, the day Crude Oil bottomed, and exited at the April 2010 high, the gain was the same 17%. Not exactly a trade to write home about.
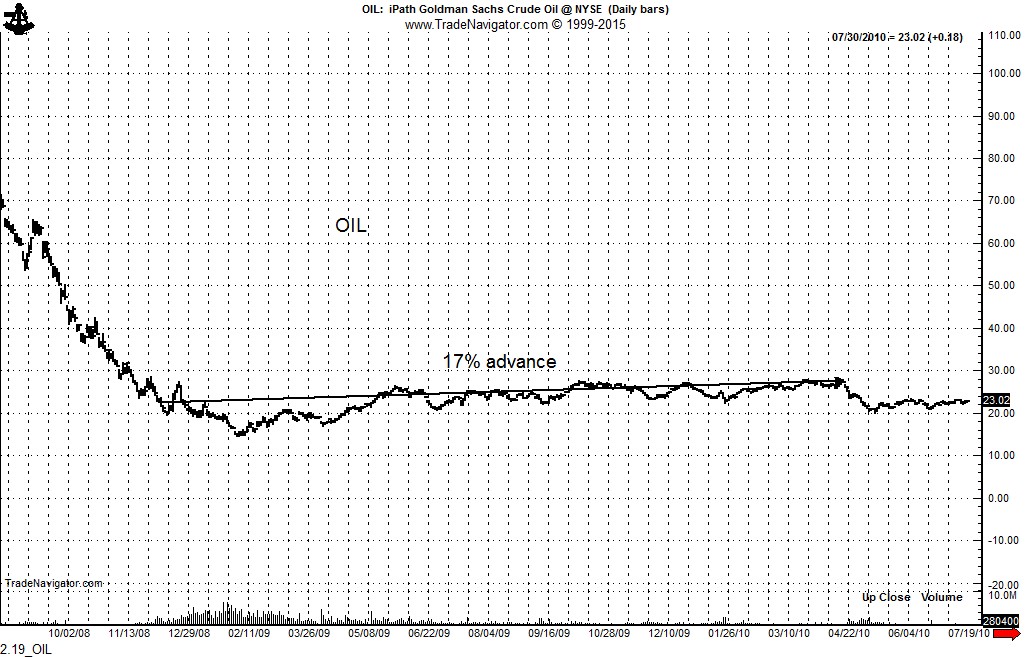
The current spread structure in Crude Oil futures has adopted the same profile as was the case at the 2008 low. The Dec 2016 futures closed today at 63.26, representing a 43% advance from the low made by the Feb 2015 contract. The frosting is off the cake. Worst case — Dec 2016 Crude Oil could decline to the mid $40’s as the market endures two to three years of depressed prices.
Best shorter-term case — a rally by Dec 2016 Crude toward $70 could be a short sellers delight. Crude Oil prices fell a very long way in 2014, so a sharp snap-back rally is possible. As a classical chartist, I do note a possible H&S bottom in the Dec 2016 contract — so a rally toward $75 cannot be ruled out. But such a rally should be gobbled up by hedgers.
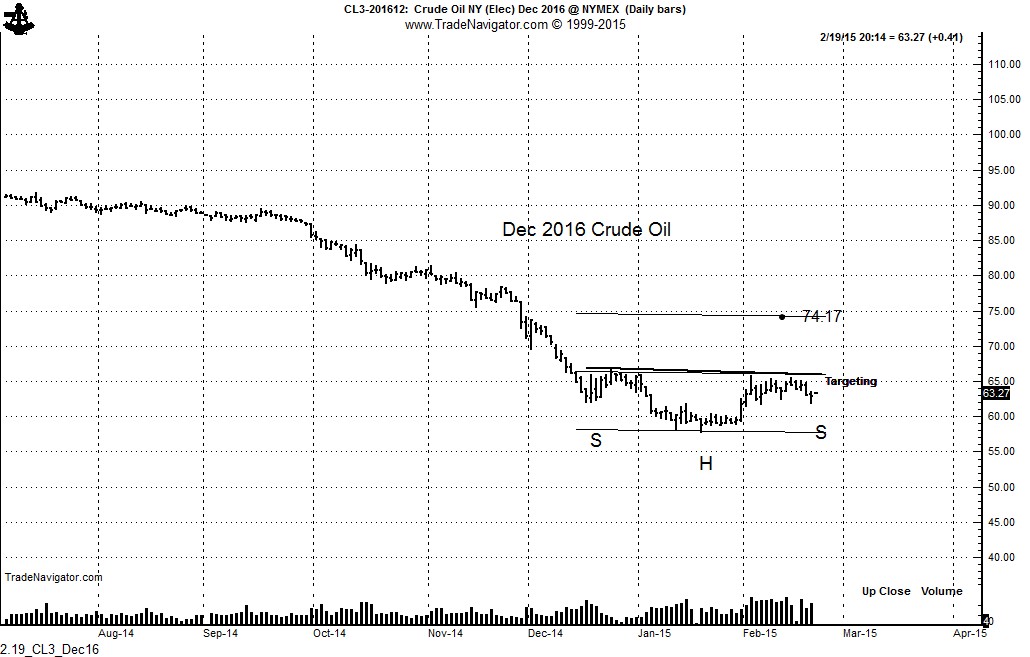
Bottom line — spot Crude Oil may have bottomed, but making money on the long side will be for the quick and nimble. The deferred Crude Oil contracts have not yet seen their lows, although a dead-cat bounce could occur.
Gold summary
My perspective on Gold is unchanged. Gold is the ultimate charting market. The Gold market has always announced its intentions with the formation of a recognizable chart pattern. For background, please read the “Chart History of the Gold Market.”
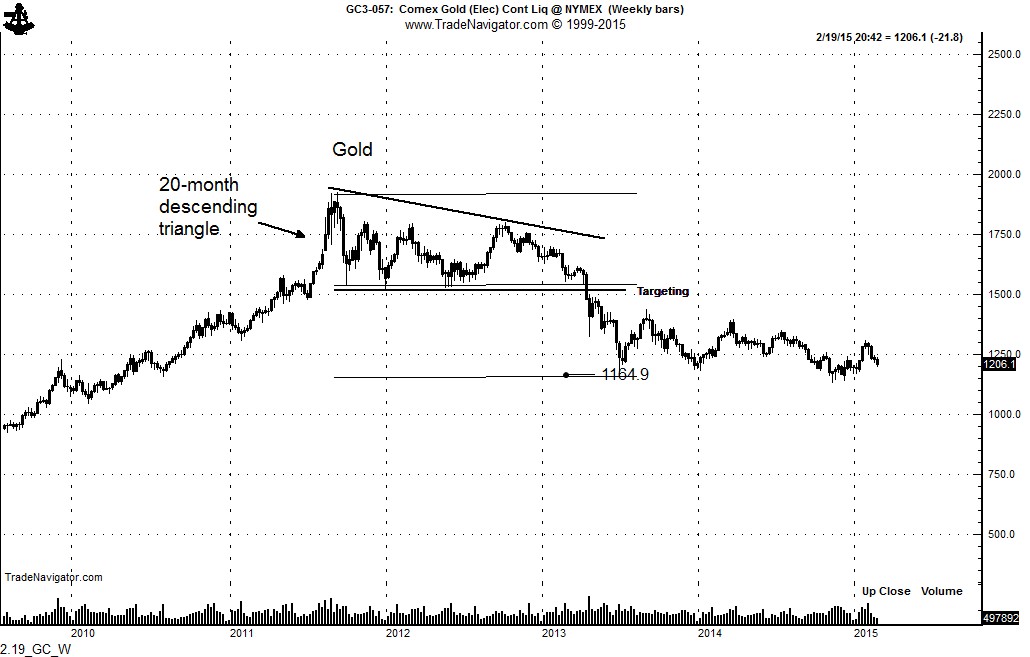
The last major pattern in Gold was the 20-month descending triangle top completed in Apr 2013. The target of 1165 from this pattern has been met.
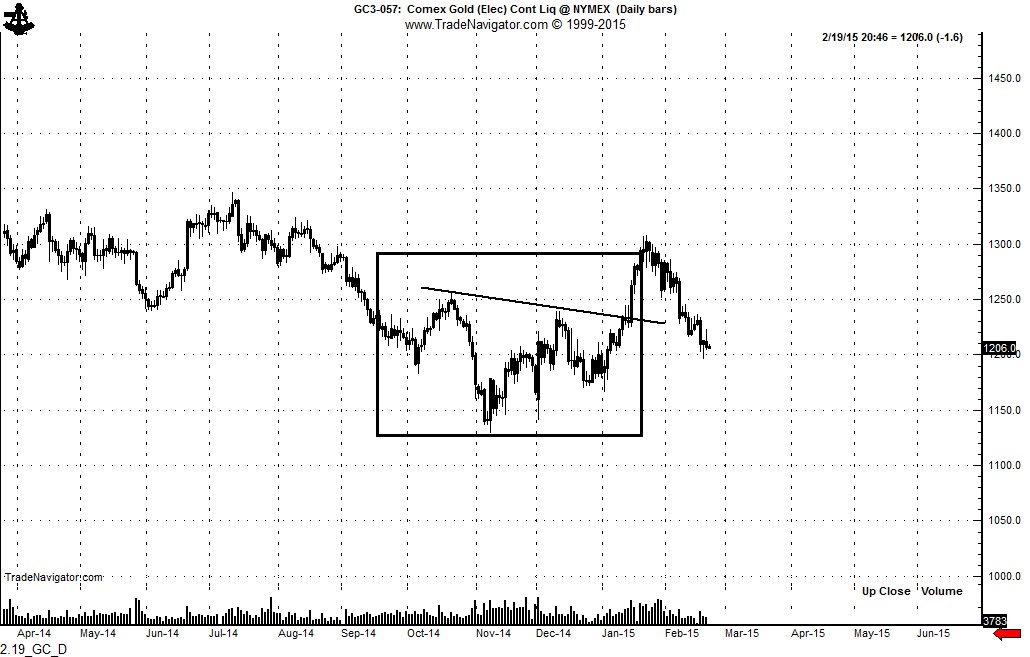
Yet, Gold has not developed a daily chart bottom — and I believe this is a necessary condition for any future bull market in the metal. I thought Gold had formed a H&S bottom in Jan 2015, but the recent decline has been too severe, so we are back to the drawing board. I see no trade in Gold at the present time.
Disclaimer: This post represents the type of technical analysis provided on a regular basis to members of the Factor service. Within the next few months the Factor service will impose a limit on the number of members — and an application process and waiting list will implemented. For more information on the Factor service, see the menu bar above.
