After a near correction of 10% in the U.S. equity market, many traders hid behind their chairs as volatility had one of its largest multi-day advances in the last several years. While the cause of the downturn, whether it be the Ebola scare, ISIS, the end of QE, or the fact that the Royals aren’t playing as well as they should be, is irreverent in my opinion, but it’s interesting to note who may have been buying the dip.
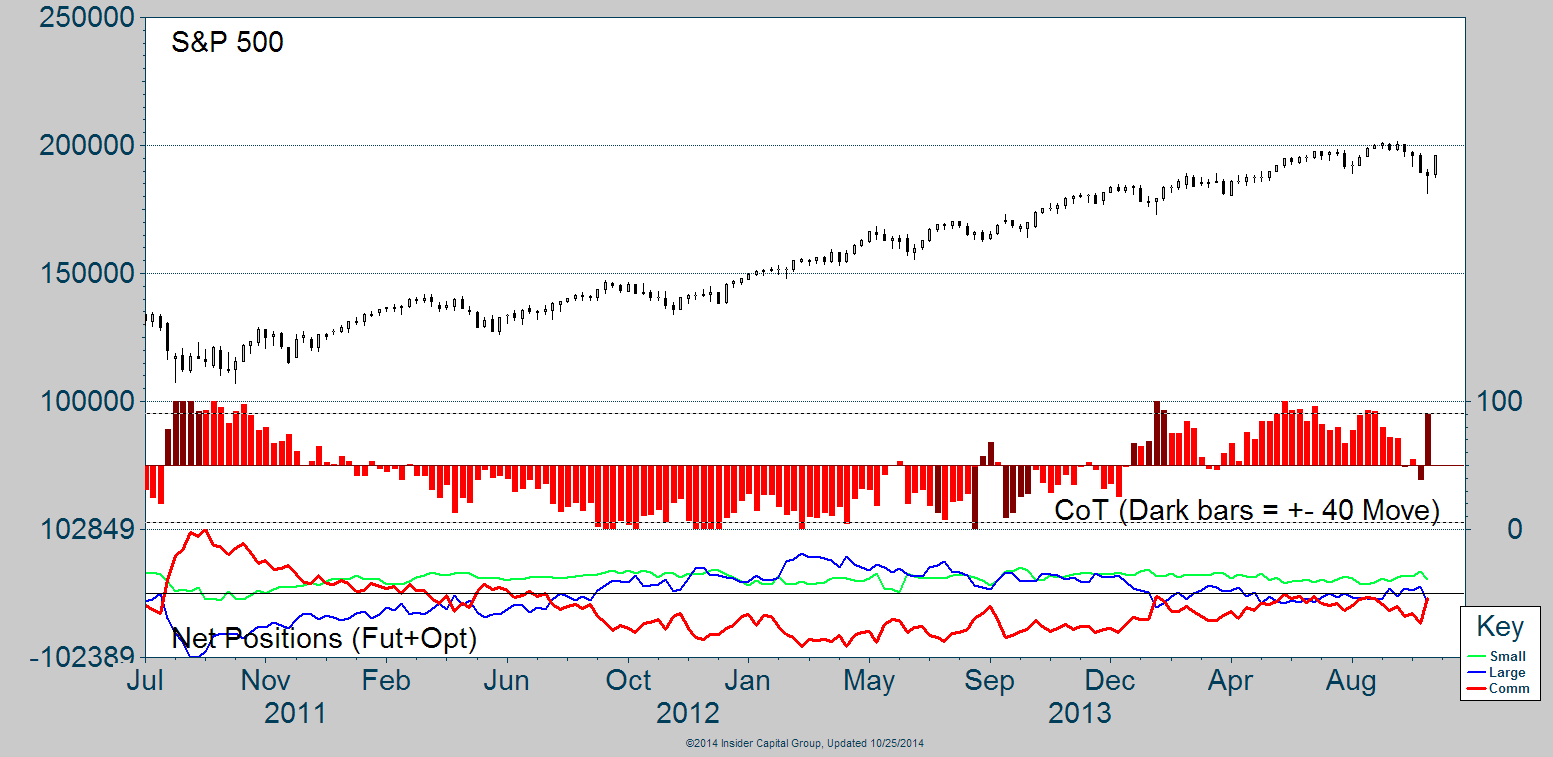
In a recent Market Masters post I wrote for See It Market, I discussed using Commitment of Traders (COT) data as a tool to seek out turning points in varies markets. COT data is like a footprint left by buyers and sellers in the futures and options market. Luckily those footprints get categorized by the type of trader that left it. Below is a chart of the S&P 500 along with its corresponding COT net-positions in the bottom panel.
The red line represents Commercial Traders, who are large institutions and are often considered the ‘smart money.’ It’s not very often we see this trader group become net-long the equity futures markets. However, when they do get close to being or do become net-long, a bottom is often put in for the market. Last week we saw an example of this as markets were falling the Commercial Traders increased their position pushing it nearly to being net-long.

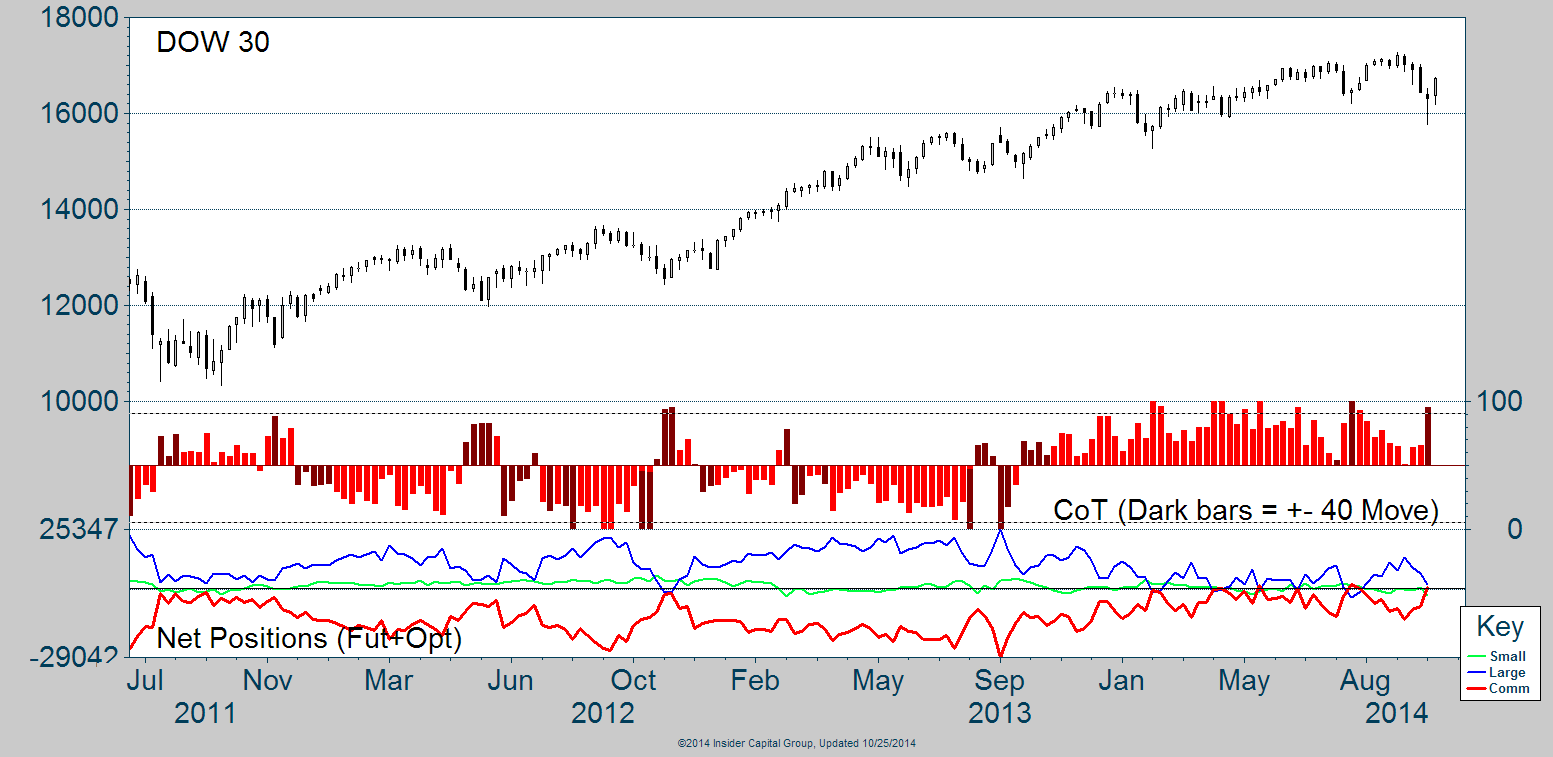
Another instance of institutions adding to their positions can be seen for the Dow. Commercial Traders became net-long as they followed Buffett’s mantra of buying when there’s blood in the streets. The increase in volatility appears to have opened that door for institutional traders as they have continued to stay aggressive as they have been buying the dips and going net-long at each dip so far this year.

What will be telling going forward is if we do not see equities continue to rally and the market moves against the ‘smart money.’ Do they keeping buying or does the wave of selling overpower them to keep stock prices elevated? This is something I’ll be watching as we get a new set of data at the end of each week.
Disclaimer: Do not construe anything written in this post or this blog in its entirety as a recommendation, research, or an offer to buy or sell any securities. Everything in this post is meant for educational and entertainment purposes only. I or my affiliates may hold positions in securities mentioned in the blog. Please see my Disclosure page for full disclaimer. Connect with Andrew on Google+, Twitter, and StockTwits.
