In January I announced a new portfolio, a Benjamin Graham “inspired” value stock portfolio. The purpose of the hypothetical portfolio is to track returns for a portfolio of 15 stocks selected based on a variety of valuation metrics. I originally intended to update the portfolio monthly; however, in the spirit of creating a lower turnover, value-driven portfolio it is now updated approximately once per quarter. I have also added an additional criteria to limit turnover in the portfolio (see below).
The Graham portfolio is an attempt to add a value strategy to Scott’s Investments, which is otherwise focused on momentum, trend, income and market timing strategies. There are numerous ways to add market timing or hedging techniques to any stock portfolio, such as shorting the S&P 500 when it trades below a long-term moving average while simultaneously holding a portfolio of long stock positions. However, for the purposes of this portfolio there will be no additional timing or hedging techniques.
The criteria used to select the stocks are listed below. The tools used to perform the screen and backtests are courtesy of Stockscreen123 (“SS123”) and Portfolio123 (“P123″).
The actual screen factors are below:
- Liquidity filter: No OTC Stocks
- Eliminate companies classified in the Miscellaneous Financial Services Industry, most of which are investment companies and funds and not the kind of stocks this all-star tended to seek
- Current ratio must be at least 1.5
- Long-term debt must be no higher than 10% above working capital
- EPS must be above breakeven in each of the last four quarters and in each of the last five annual periods
- Trailing 12 month EPS most be above EPS in the latest annual period
- EPS in the latest annual period must be above EPS in the prior year and five years ago
- The company must have paid common dividends in the last 12 months
The ranking system used as a basis for selecting the top 15 based among those stocks that pass the Graham screen are below:
- Valuation – 60% of total
- Trailing 12 month P/E (15% of this category)
- Price-to-Book (15% of this category)
- Price-to-Tangible Book Value (35% of this category)
- Operating P/E, defined as Market Capitalization divided by Business Income, which is Sales minus Cost of Goods sold minus Selling, General & Administrative Expense and omits unusual items (35% of this category)
- Earnings – 40% of total
- 5-year EPS Growth Rate (50% of this category)
- EPS Stability, defined as the standard deviation of EPS over the past 16 quarters, lower being better (50% of this category)
I began tracking this portfolio real-time on January 13th, 2012. As of this writing, the portfolio is down 2.11% including dividends,compared to a positive return of 11.63% (excluding dividends) for SPY over the same period and 10.5% for Vanguard Small Cap Value ETF (VBR) over the same time period.
The portfolio has been hampered by big drawdowns in a handful of names, which the quantitative rules continue to define as undervalued. These are excellent examples of the challenges in value investing – a stock could be defined as under-valued for a good reason, and may remain so for a significant period of time, perhaps years or forever if the company has experienced a permanent and material change in operations (a “value trap”). On the other hand, under-valued stocks may lag longer than investors wish, but patient, longer-term investors who aptly select value stocks can be rewarded in the long-run.
A real-world application of this portfolio could also utilize stop losses in order to prevent large drawdowns in single positions. However, for the purposes of tracking the portfolio results, all positions are bought and held until rebalancing.
In July a rule was added to help limit portfolio turnover – stocks will only be sold when they drop out of the top 20 in Graham Value screen. Thus, a stock could theoretically drop to the 20th ranking but remain in the 15 stock portfolio if it is a current holding.
An interesting early trend in live tracking is that of smaller, less liquid equities appearing frequently on the list. This makes for a potentially more volatile, higher beta list of equities. This could also be of concern for those nervous about equity markets. As mentioned earlier one potential strategy for hedging equity positions would be to short the overall equity market when an index such as the S&P 500 drops below a long-term moving average.
Another filter worth consideration is one based on market capitalization. Given my personal level of discomfort with stocks with ultra low market capitalizations, and especially those based overseas, going forward any new additions to the portfolio will be required to have a market cap greater than $100 million. Three stocks remain in the portfolio with market caps below $100 million but no new stocks will be added with market caps below $100 million.
The top 20 stocks based on the screen criteria (no market cap requirement) are listed below: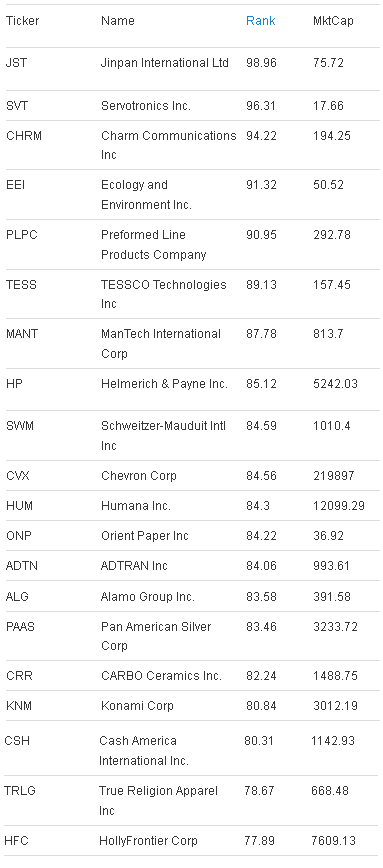
Below are 3, 5, and 10 year backtest results for this screen (with no market cap requirement) using a quarterly rebalance and .5% slippage to help account for bid/ask spreads and commission costs: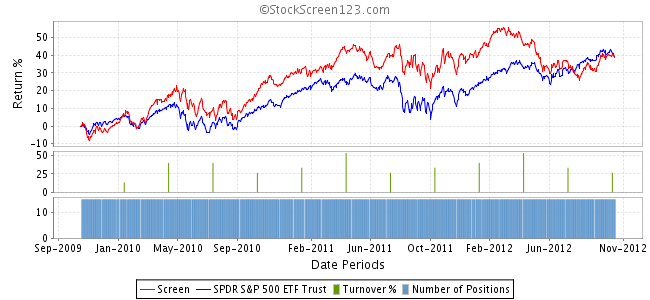
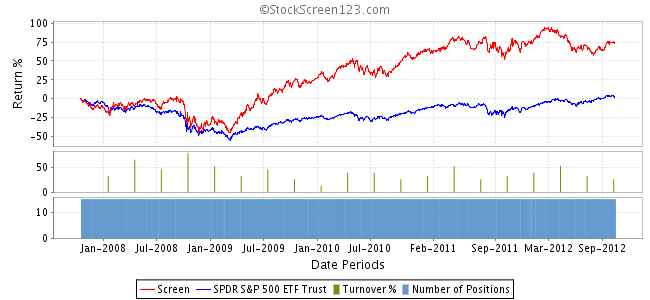
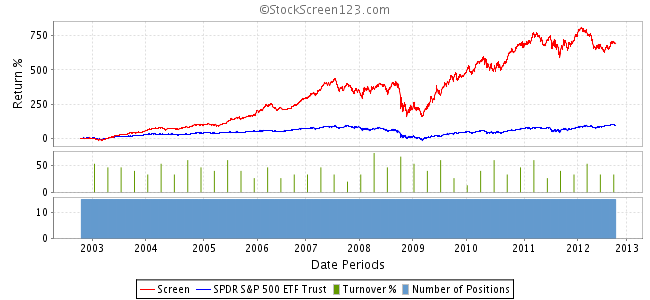
The 10 year results with the added $100 million market cap criteria is below: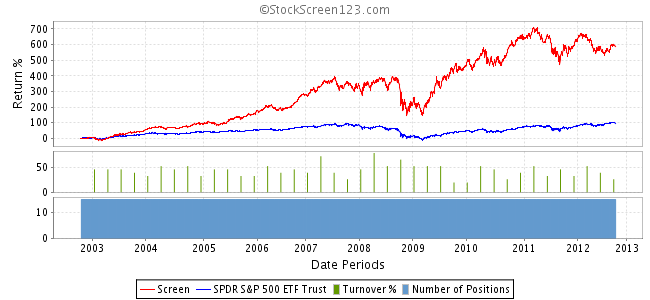
Three stocks were sold at today’s close – Formula Systems (FORTY), Walgreen (WAG) and Deer Consumer Products (DEER). The proceeds were used to purchase Schweitzer-Mauduit Intl Inc (SWM), ADTRAN Inc (ADTN), and CARBO Ceramics Inc. (CRR). Current holdings are below: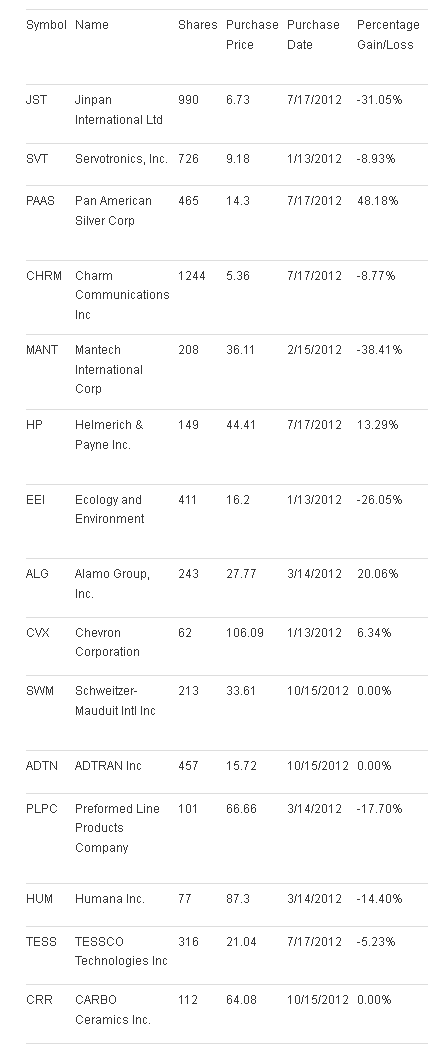
Disclaimer: Stock Loon LLC, Scott's Investments and its author is not a financial adviser. Stock Loon LLC, Scott's Investments and its author does not offer recommendations or personal investment advice to any specific person for any particular purpose. Please consult your own investment adviser and do your own due diligence before making any investment decisions.
