In yesterday’s intraday Alert, we explained why the short-term outlook for the precious metals changed from bearish to neutral and we took profits from our short positions. It was not just the fact that the price targets were reached for gold and silver. The key to the change in the outlook was seeing the confirmations from XAU/USD and from the mining stocks’ performance compared to the one of gold. In today’s analysis, we’ll take a closer look at what happened and what it means going forward.
Let’s start with gold (charts courtesy of stockcharts.com).
Gold At Downside Target
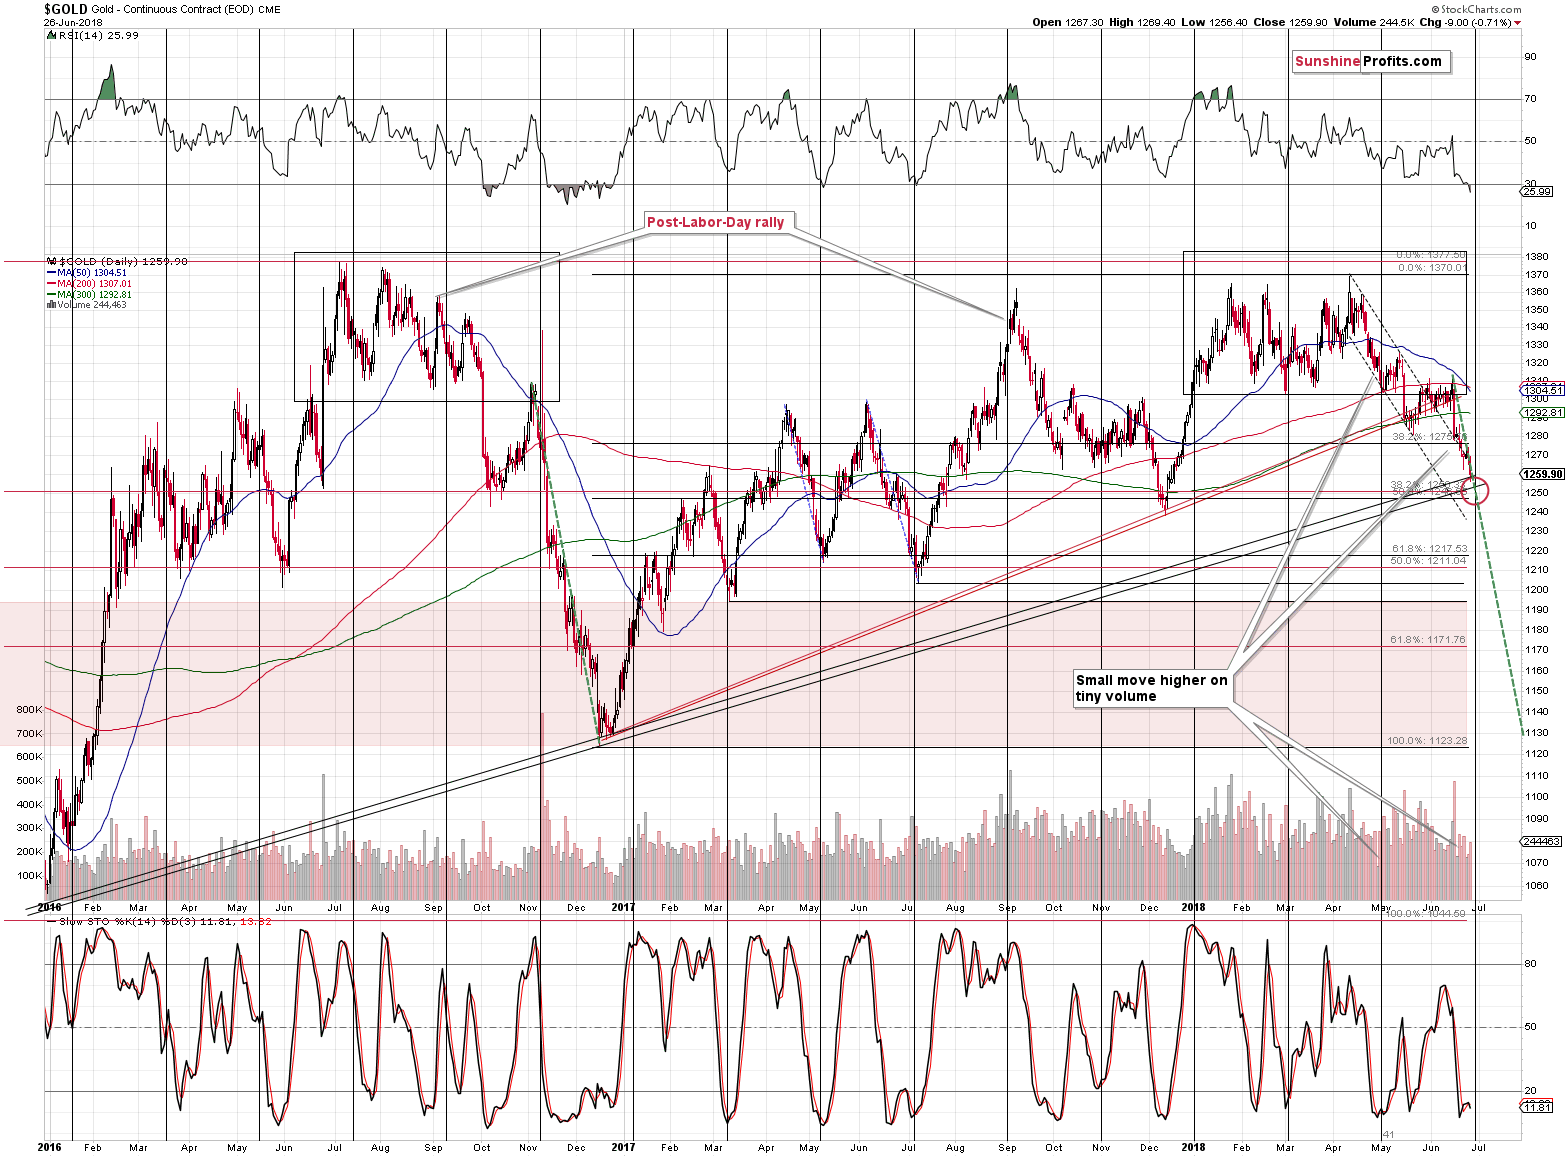
Gold moved to the upper part of our target area and it did so one day before its cyclical turning point and with RSI below 30. That’s a bullish combination for the short term.
Naturally, RSI below 30 is no guarantee of higher prices in the near term, just like it didn’t trigger them in the final months of 2016, but in light of the significance of the rising support line, it’s something worth keeping in mind.
The analogy to the final months of 2016 still suggests that lower gold prices are likely to continue, so the upcoming corrective upswing (if we really see one) should not be huge. If you’re new to our analyses and are not aware of the analogy to 2016, please compare the two areas that we marked with black rectangles. In 2016 and 2018, we saw several tops close to $1,350 and bottoms close to $1,300, which was followed by a breakdown and a move back to the previous lows and then a move to new lows. The similarity continues so far, which means that gold is likely to decline even further from here. This part of the analogy is represented by the dashed green line on the above chart.
Let’s move back to the rising medium-term support line.
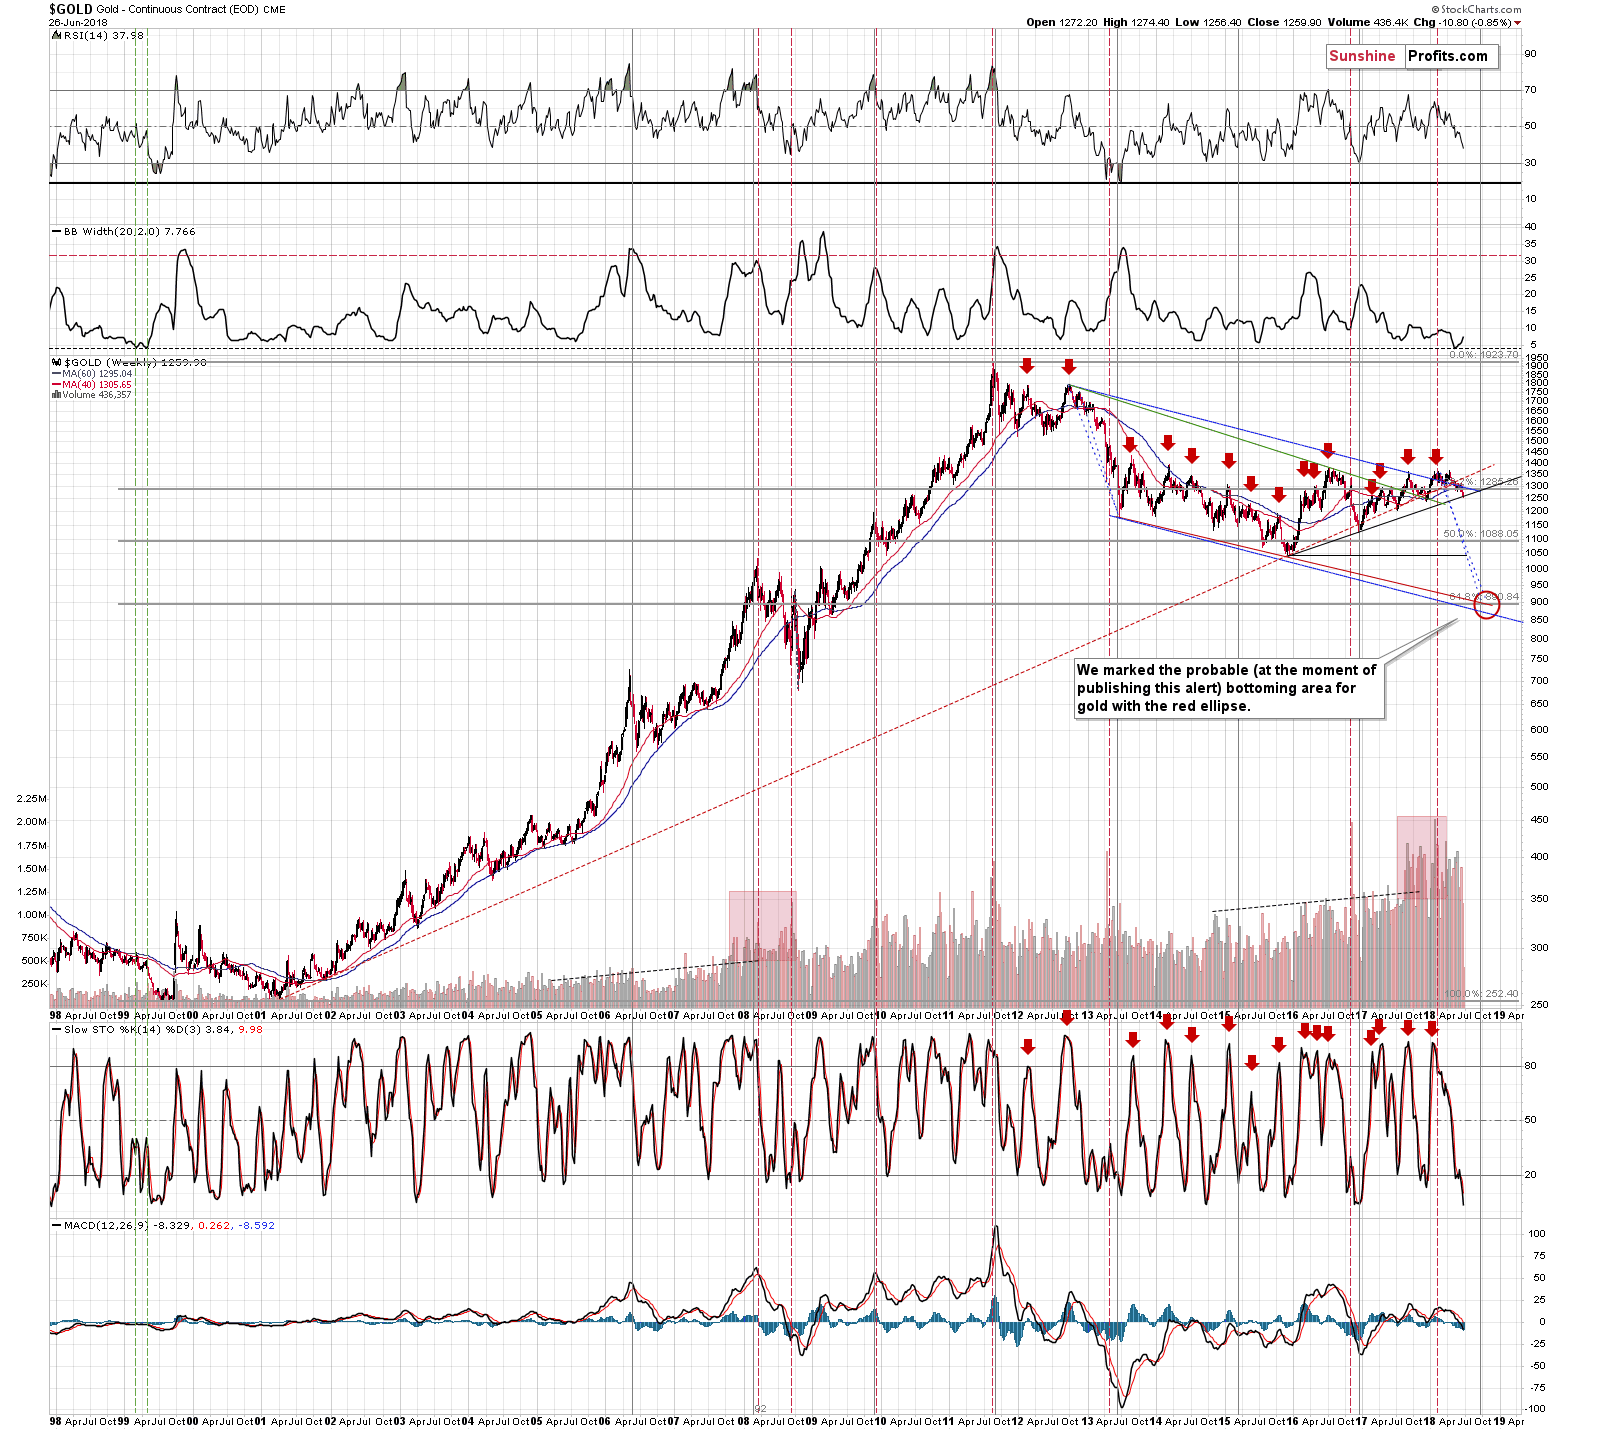
Reaching it is a big deal, because it’s the biggest and most visible rising medium-term support line there is. Only the long-term, rising, red, dashed support line is more prominent, but a breakdown below it is more than confirmed, so it’s no longer a factor that could trigger any moves.
From the long-term point of view, it’s clear that this line was reached, even though on the previous short-term chart only the upper of the two rising lines was touched. The upper one is based on the closing prices, while the lower one is based on intraday lows. Does it matter much? Not really – it only indicates that gold might move a bit lower today. Today’s overnight low was about $1,254, so perhaps the bottom was already reached.
Let’s move back to gold’s cyclical turning point. You see, it’s not the only time-related factor that points to a nearby reversal.
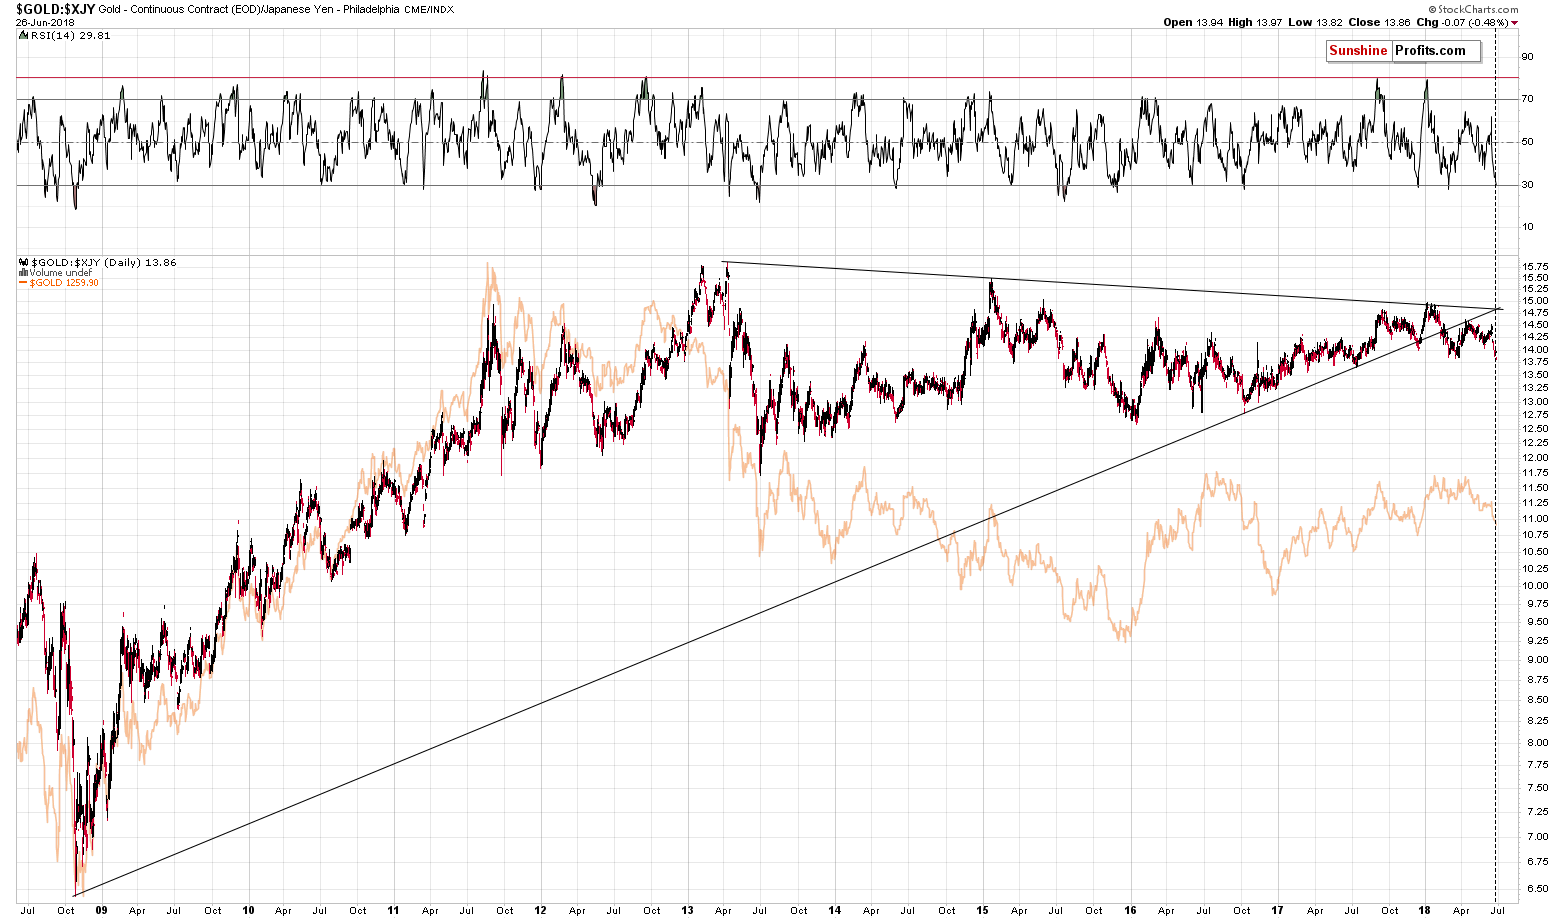
The gold price in terms of the Japanese yen has similar implications. The triangle based on support and resistance lines that are based on the key extremes, has the apex right now. This means that the price of gold from this perspective is likely to reverse its direction. The most recent move was definitely to the downside, so the implications are bullish.
The short-term moves in gold from the Japanese perspective and from our regular USD point of view are similar, so the above has bullish implications also in USD terms.
Having said that, let’s take a look at silver.
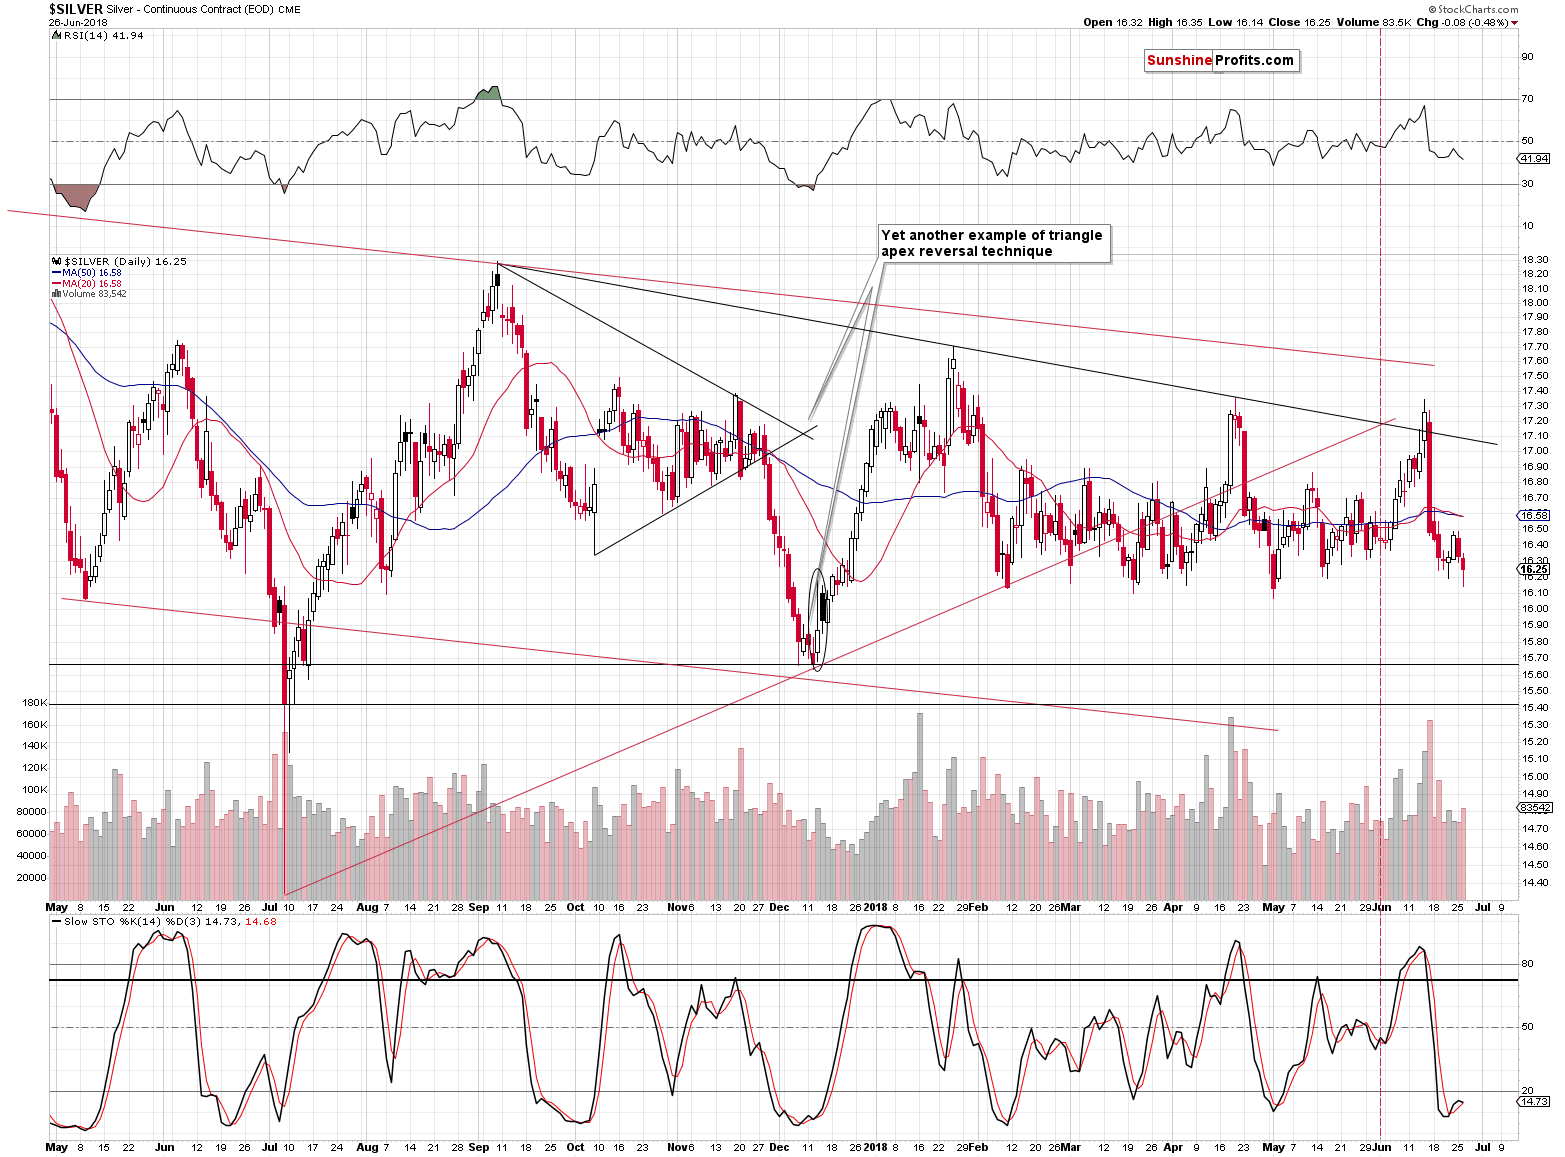
When we were previously discussing the price target for gold, we also wrote about $16.10 being the likely target for silver. The reason was that this is the price level that stopped multiple declines in the past few months and since history repeats itself, it could happen once again.
Given the medium-term downtrend in which the precious metals market remains, the above didn’t have to translate into a change in the outlook, but since gold moved to its target at the same time as did silver and we saw additional bullish signs, it seems that the $16.10 target will be able to stop the decline for some time after all.
Before moving to mining stocks, let’s take a look at silver from the broader perspective.
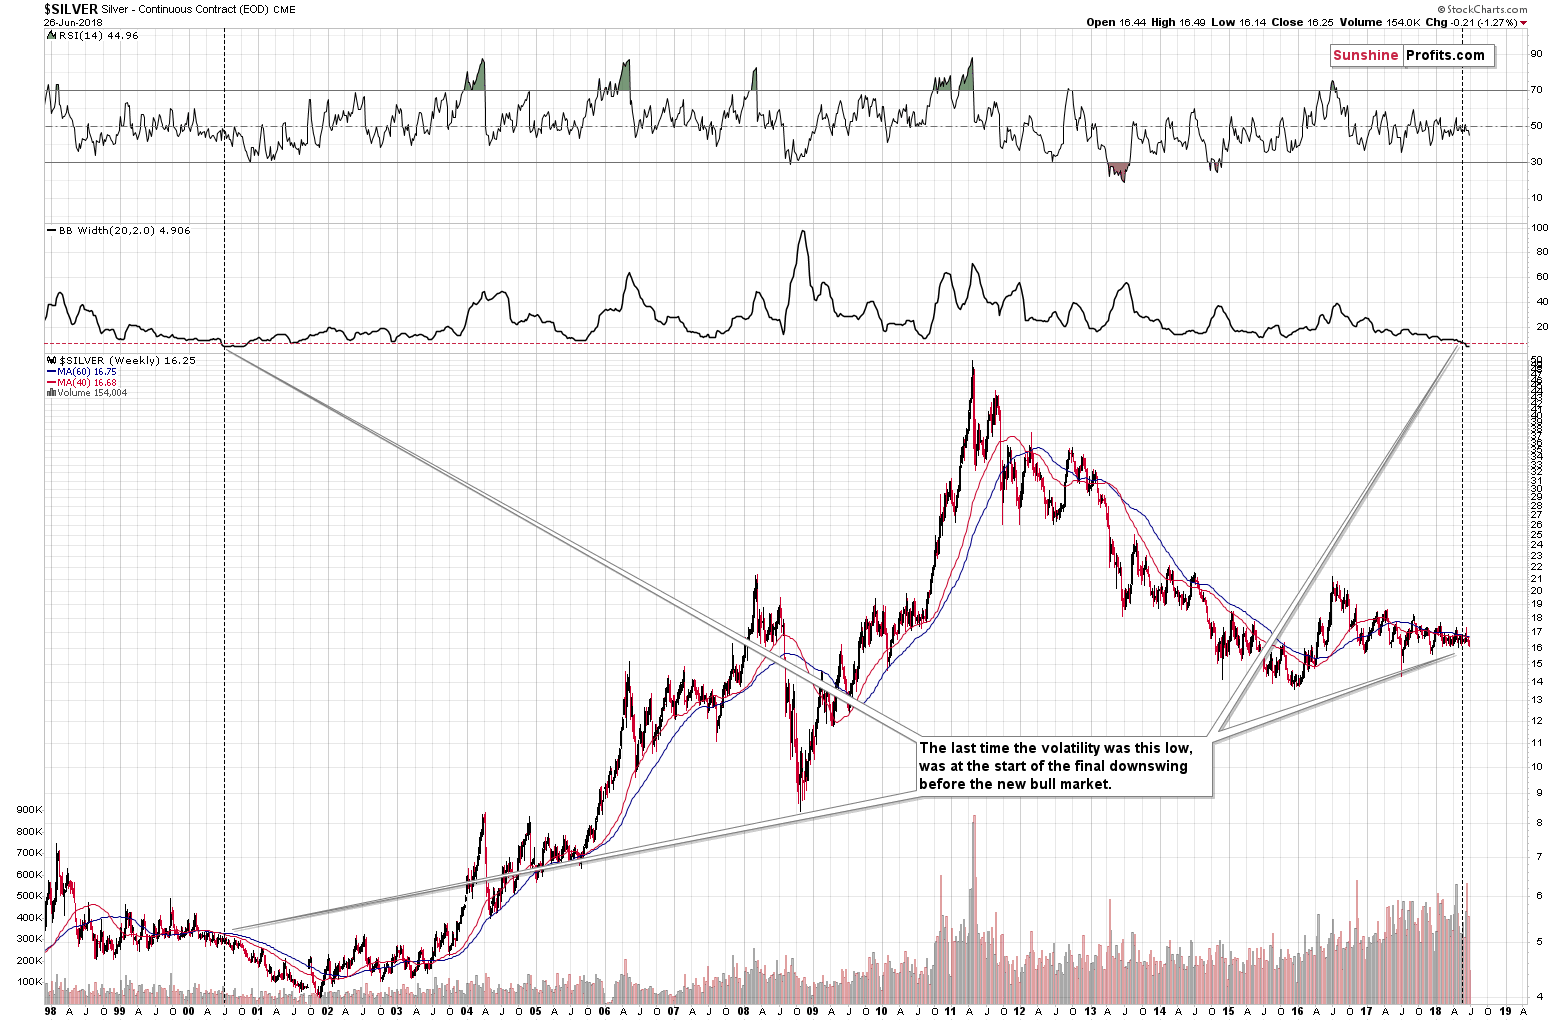
Looking at silver’s long-term volatility, it appears likely that the white metal is starting a big move and this move is likely to be to the downside. The second indicator from the top is Bollinger® Bands’ width, which is a proxy for volatility. Whenever the market becomes too calm, it suggests that a big move is just ahead. It’s just like the calm before the storm and this phenomenon works for both: rallies and declines.
In the current case, we also have the analogy to the previous case when the volatility was as low as it is right now – it was in 1999 right before the final decline to the ultimate silver price bottom. We’ve been writing for a long time that a one additional big decline is necessary to make the sentiment bad enough for the true final bottom to form. The current extremely low reading of the Bollband’s width serves as a confirmation that this move is likely underway.
Consequently, from the medium-term point of view, the outlook remains very bearish, but from the short-term point of view, a corrective upswing could still take place.
Let’s take a look at the GDX.
Miners’ Very Short-term Strength
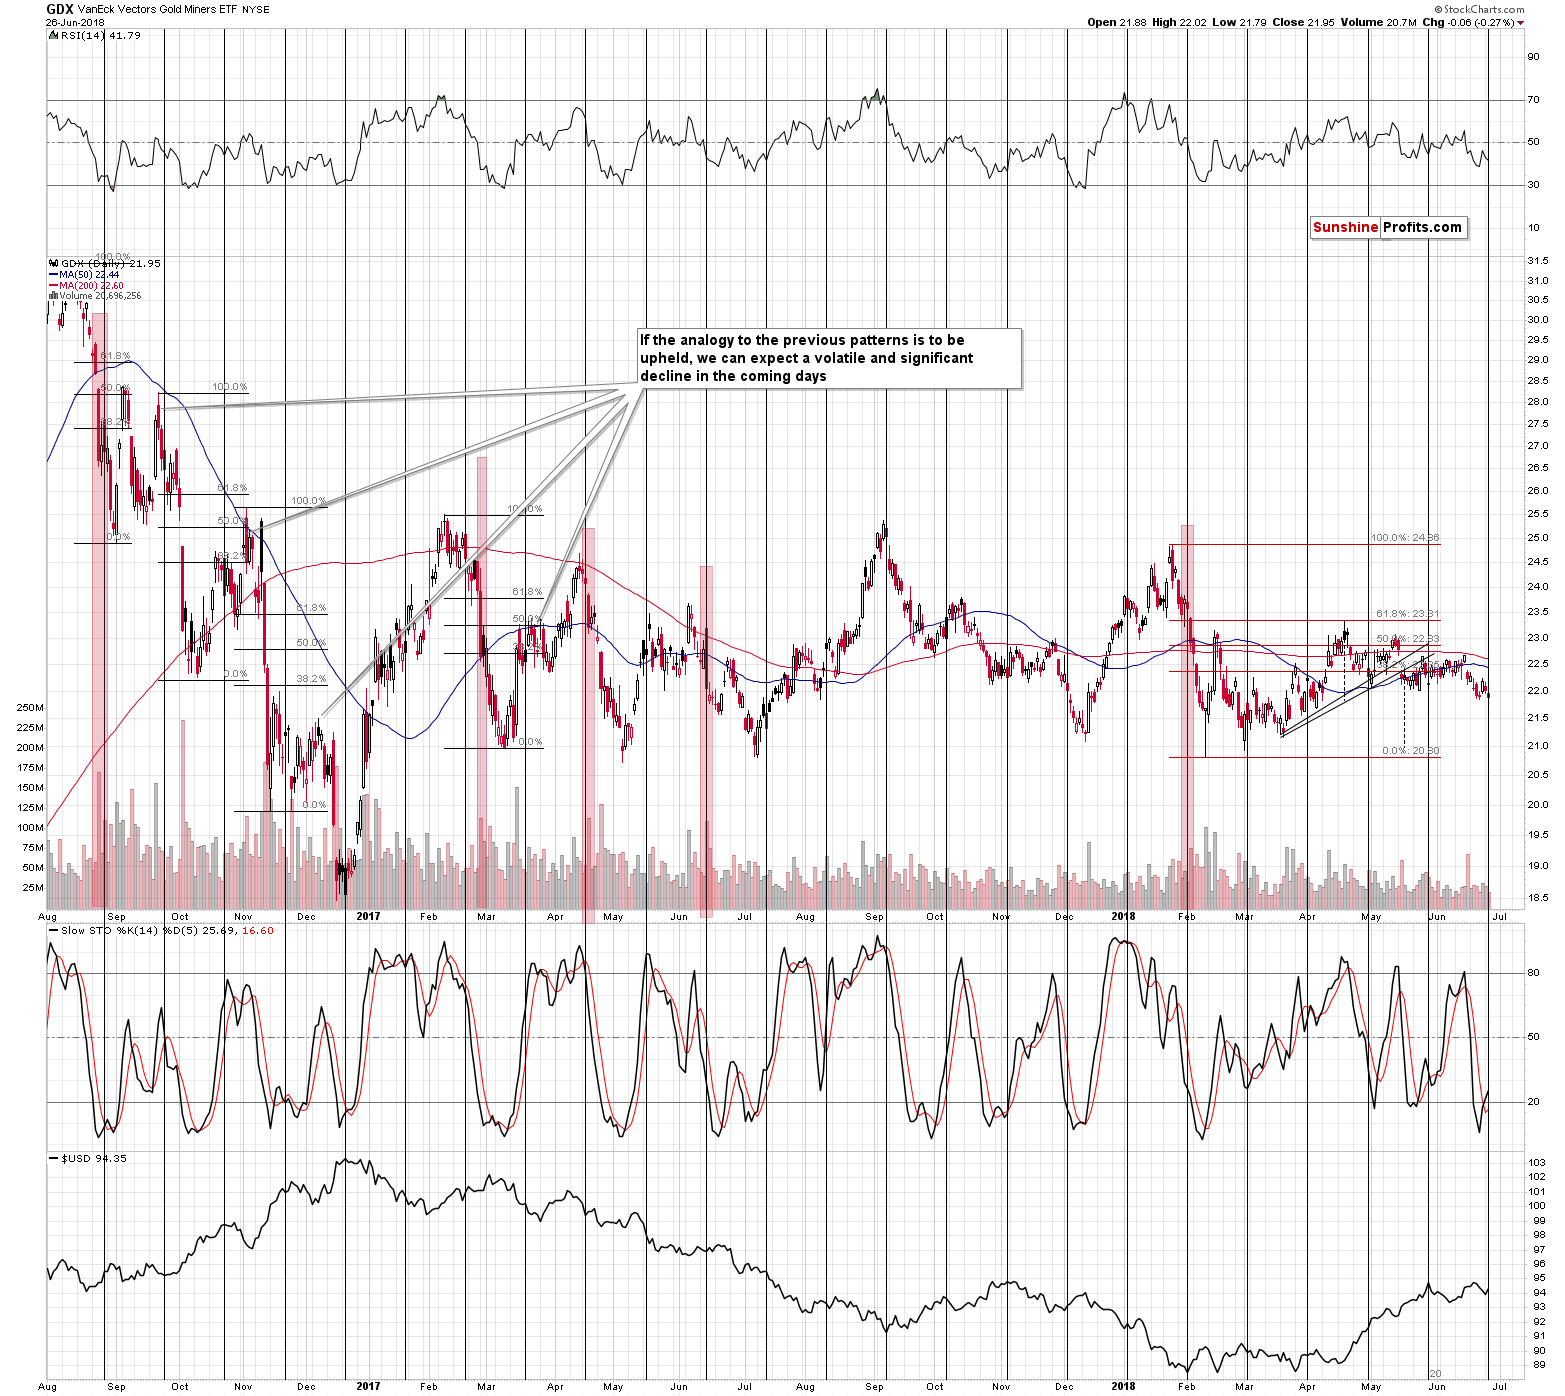
Mining stocks started the session low and they managed to move back up despite the $9 decline in gold. The GDX ETF didn’t move above the previous days’ closing price, but it ended the session only 6 cents lower, which is a sign of strength.
Yesterday’s reversal was not accompanied by huge volume, so the implications are not very bullish, but the relative strength compared to gold is definitely a bullish factor.
Moreover, we saw a clearly visible buy signal from the Stochastic indicator.
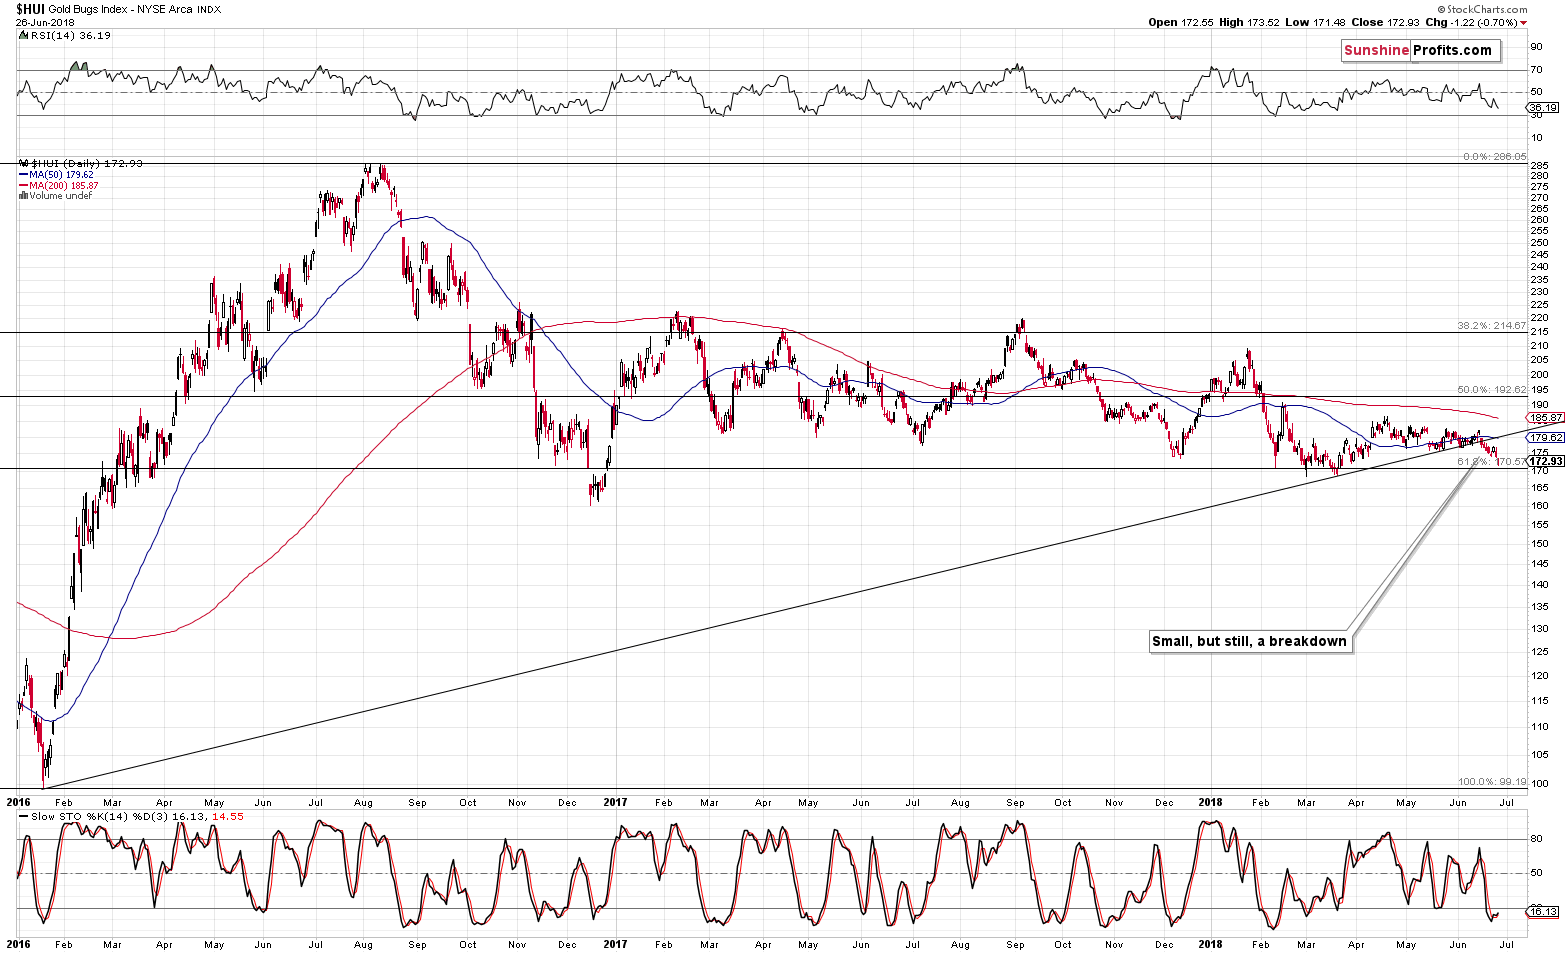
The ARCA Gold BUGS, proxy for gold shares, is after a major breakdown, which has bearish implications for the following weeks, but it also almost reached its 61.8% Fibonacci retracement level based on the 2016 rally, which is likely to trigger a short-term rebound.
Again, this level was almost reached, so we may see another small downswing today (to about 170.60) and then a corrective rally.
The nearby turnaround is supported not only form the price point of view, but also when one focuses on the time aspect.
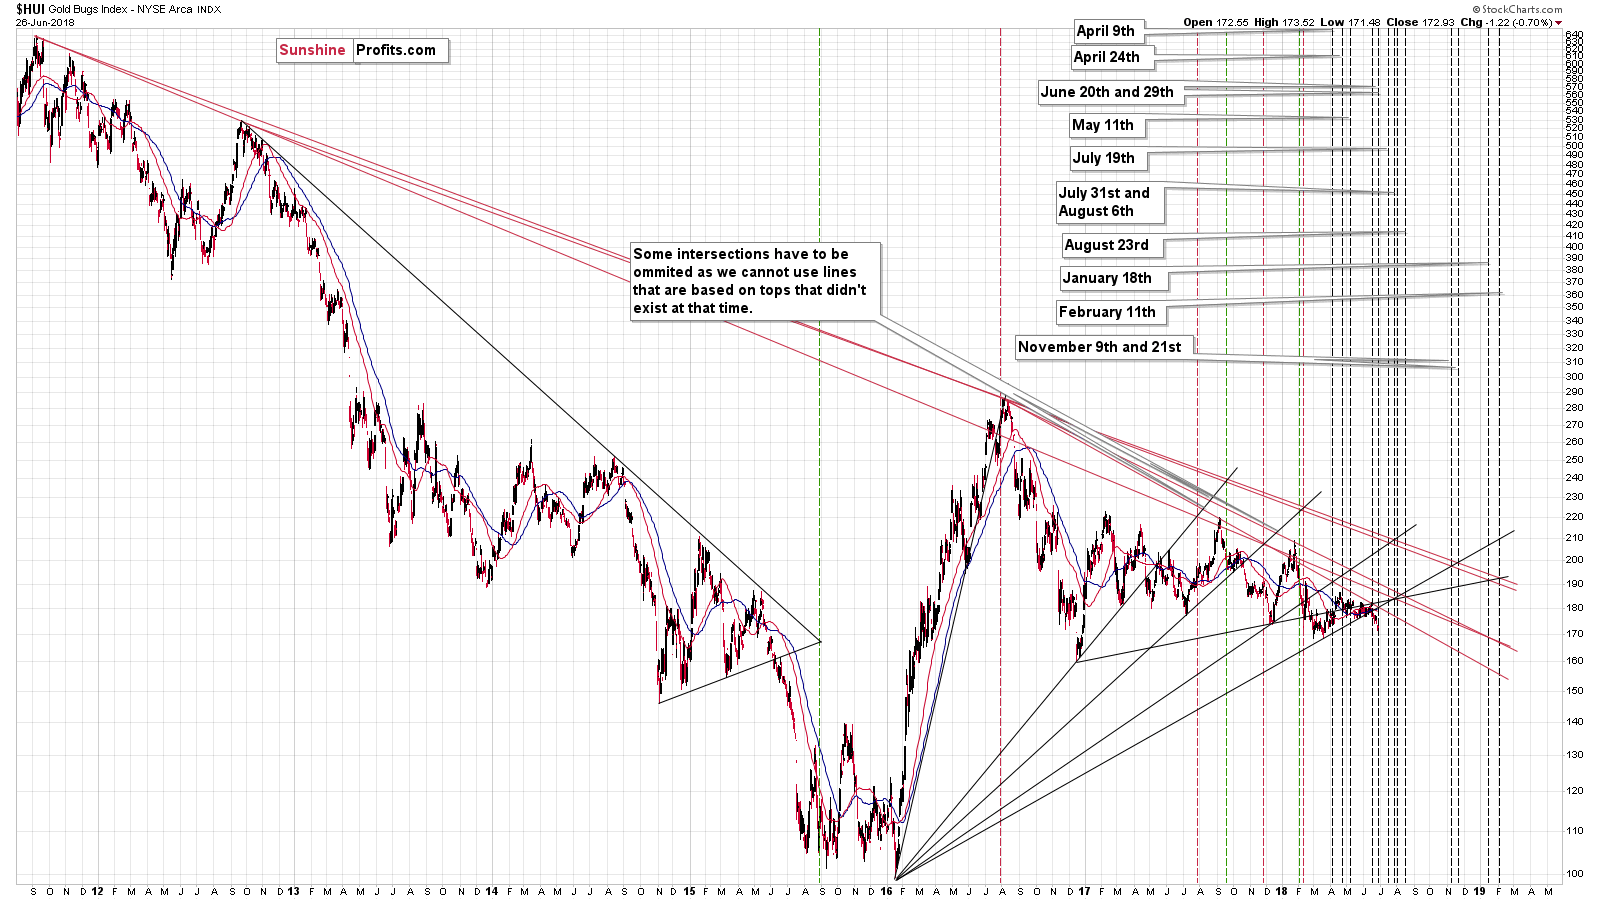
The apex of one of the long-term triangles is on Friday and since the apex-based turnarounds work on a near-to basis, we can expect a bottom to be formed this week – perhaps today. It’s also possible that it was already reached yesterday.
Silver Stocks
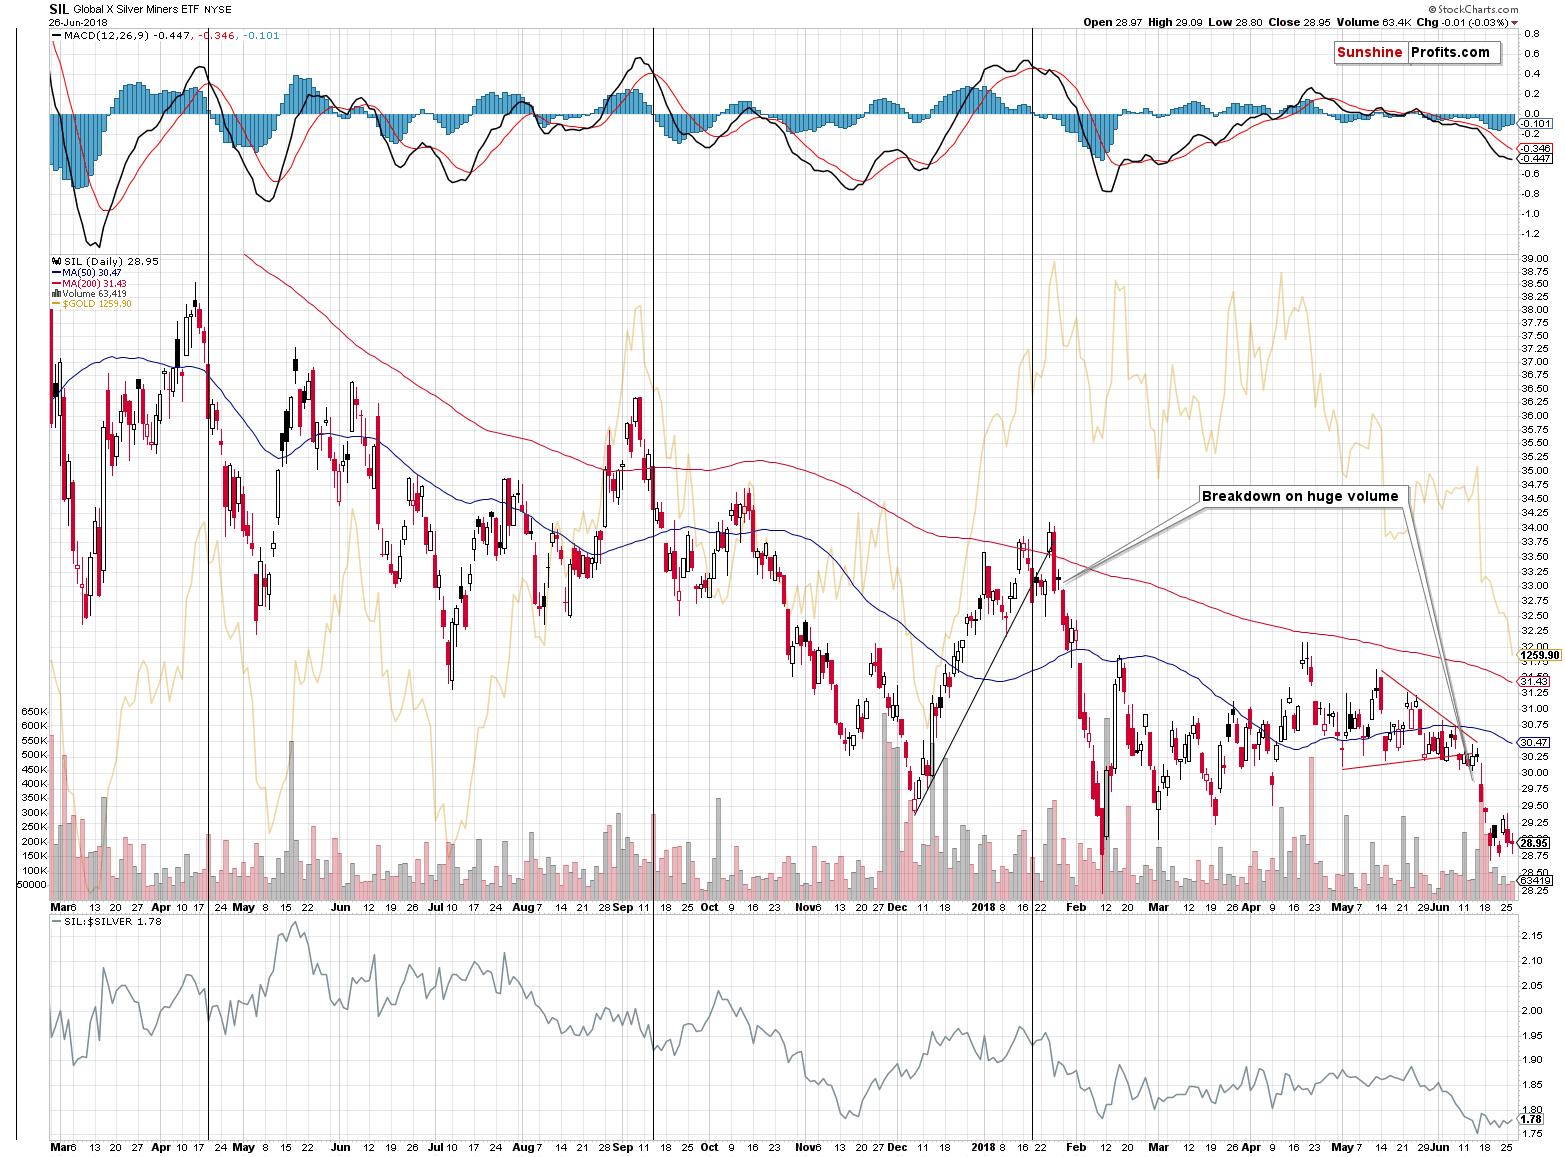
The silver stocks’ underperformance was one of the reasons that made us expect lower PM prices in the previous weeks. Now we see the opposite signal. Silver shares refused to move lower in the past several days despite a move lower in gold and silver. What are the implications? In short, silver miners suggest that it’s time for a breather.
The strongest short-term signal that made us change our near-term outlook came from the strength of gold’s reaction to the move in the USD Index.
Gold Vs. USD
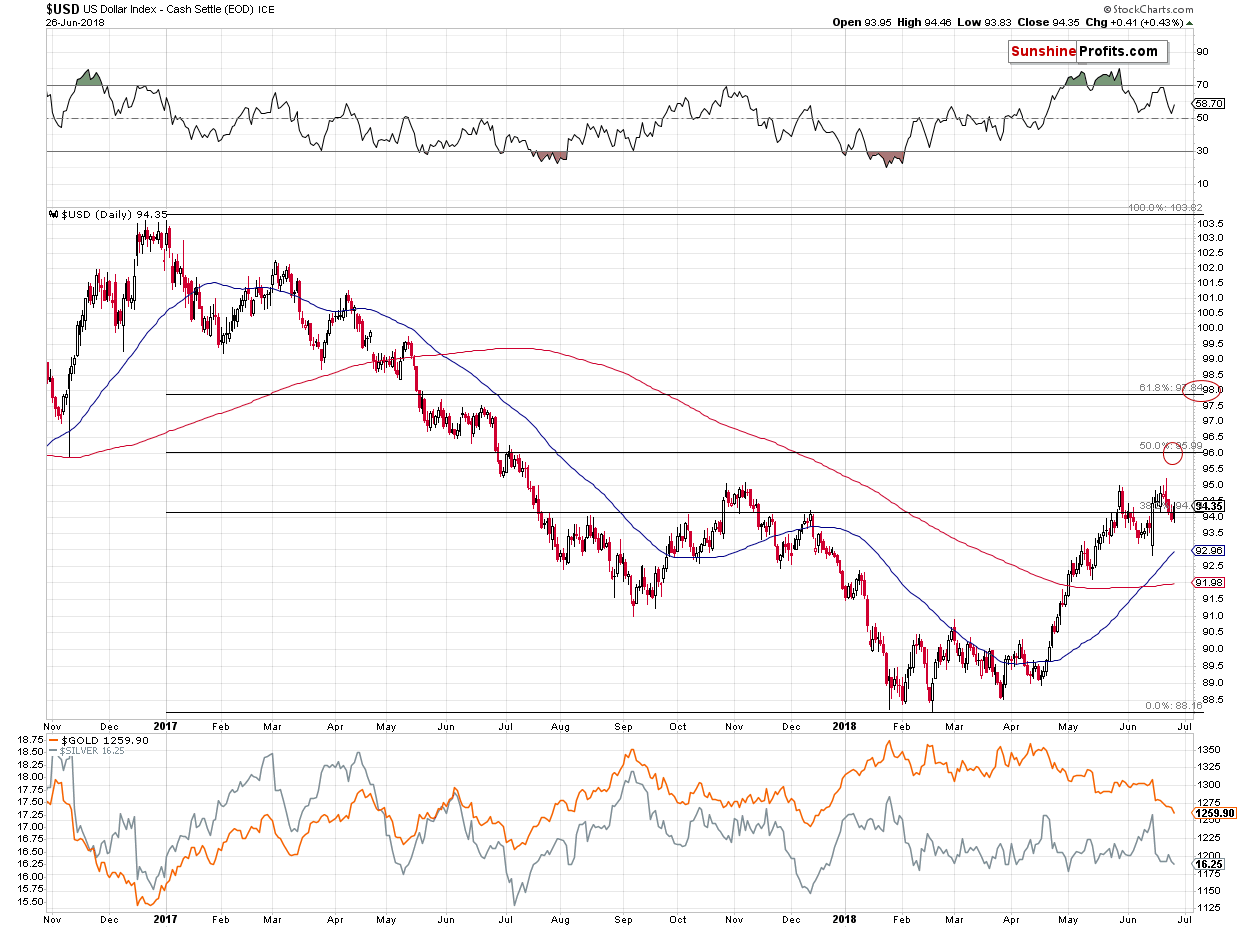
The most important action was seen in the last several hours of yesterday’s session and it's not really visible on the above chart. On the chart, you can see that gold moved lower while the USD Index moved higher, which seems like a regular course of action.
Yet, gold did show substantial strength and it goes double for mining stocks. When we posted yesterday’s first (regular) Alert, the USD Index was up by 0.20, while gold was trading at about $1,254. After that the USD Index kept on rallying and ended the session over 0.4 higher and while one might expect gold’s decline to continue, we actually saw a move higher in it. That was a very short-term, but profound sign of strength.
If we saw it on a stand-alone basis, we would have probably not reacted to it, but it happened just a day before the cyclical turning point and on a day when targets for both: gold and silver were reached. Combination of factors made the short-term outlook much more bullish than it was before yesterday’s session.
Summary
Summing up, gold and silver reached our downside targets very close to several reversal dates and it was accompanied by quite a few bullish confirmations, which makes the current short-term outlook quite bullish, but not extremely so. The medium-term outlook remains bearish, but based on the above, it’s tempting to enter into a counter-trend long position in the precious metals market right now. If we had confirmation in the form of a big-volume reversal, we would have probably entered a long position right away, but since we didn’t have it, we’ll wait for additional signs. Since the cyclical turning point for gold is today, we might get them within the next several hours.
All in all, the short-term outlook for the precious metals market improved significantly based on the recent developments and we may see a corrective upswing shortly.

