SPDR Gold Trust (ARCA:GLD) (gold etf) near term outlook:
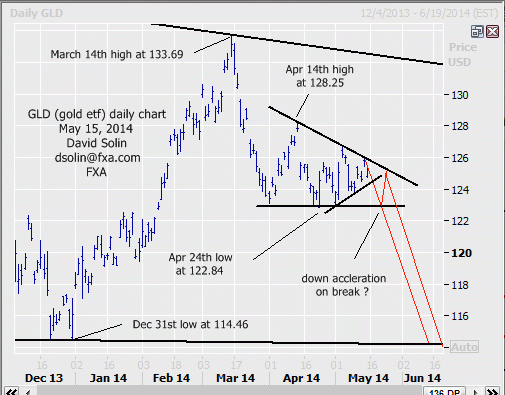
Long held, bigger picture view of eventual declines back to the June /Dec 2013 lows at 114.40/70 ($1180/85 in gold), "ideally" in the mid/late June timeframe (see long term below) remains in place. However as warned in the May 1st email, there was scope for a few weeks of consolidating before resuming the decline(see in red on daily chart below). At this point, it appears that a resumption of the , but it looks like this period of ranging may finally be complete (or near). Note that the market appears to be forming a triangle-type consolidation for over the last month, viewed as a continuation pattern and adds to the view of further downside (they often resolve sharply). Also, the seasonal chart peaks around this time (see 3rd chart below) and the broader US$ if finally seen completing a more major low (for at least a month and likely more, see email on the US$ index from Monday), with all supporting the view that a resumption of the bigger picture decline may indeed be near (see in red on daily chart below). Nearby resistance is seen at the bearish trendline from Apr 14th/ceiling of the potential triangle (currently at 125.90/15), with a break putting the triangle view on hold (though not aborting the bigger picture bearish view), support is seen at the multi-week bull trendline (currently at 124.15/30) and 122.60/90 (base of the triangle).
Strategy/position:
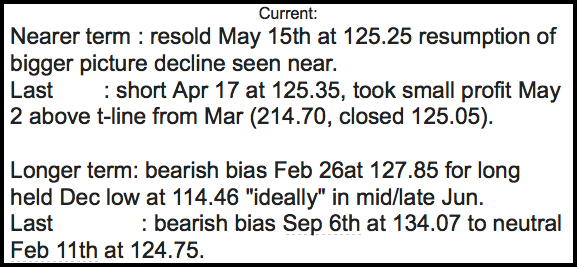
With a resumption of the bigger picture declines seen near, want to be short and would resell here (currently at 125.25). Stop on a close 25 ticks above the ceiling of the triangle, but on such a break, would looking to resell higher a week or so after.
Long term outlook:
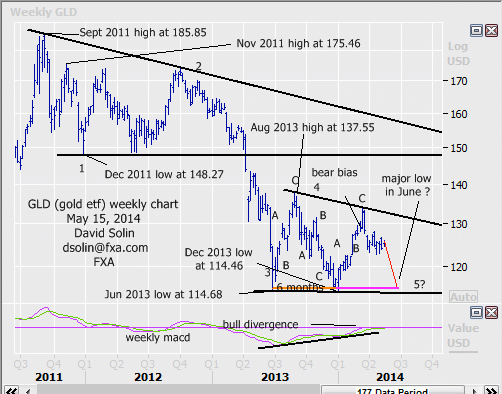
As discussed above, eventual declines all the way back to the Jun/Dec lows at 114.50/75 (and even slightly below) are still favored, as the market continues to form a huge falling wedge since last June (see weekly chart/2nd chart below). However, there are viewed as bottoming/reversal patterns and suggests that such declines may be part of a more major basing and not the start of a significant, new tumble. Note too that the market is seen within the final leg in the fall from at least the Nov 2011 high at 175.46 (wave 5), while the long discussed, key 113.00/75 support area (50% retracement from the Feb 2005 low at $41.02) lies just below that 114.50/75 area, and in turn supports the view that declines back to the 114.50/75 lows (and even below) may be limited and part of a more important bottoming. Finally, mid/late June remains an "ideal" timeframe to reach such a low as the seasonal chart bottoms then, and the time of the first low of the wedge to the 2nd low (Jun 2013 to Dec 2013) is roughly equivalent to the time from the 2nd low to mid/late June (a common occurrence within these patterns).
Strategy/position:
|


