Gold: Today's Technical Report/Commentary:
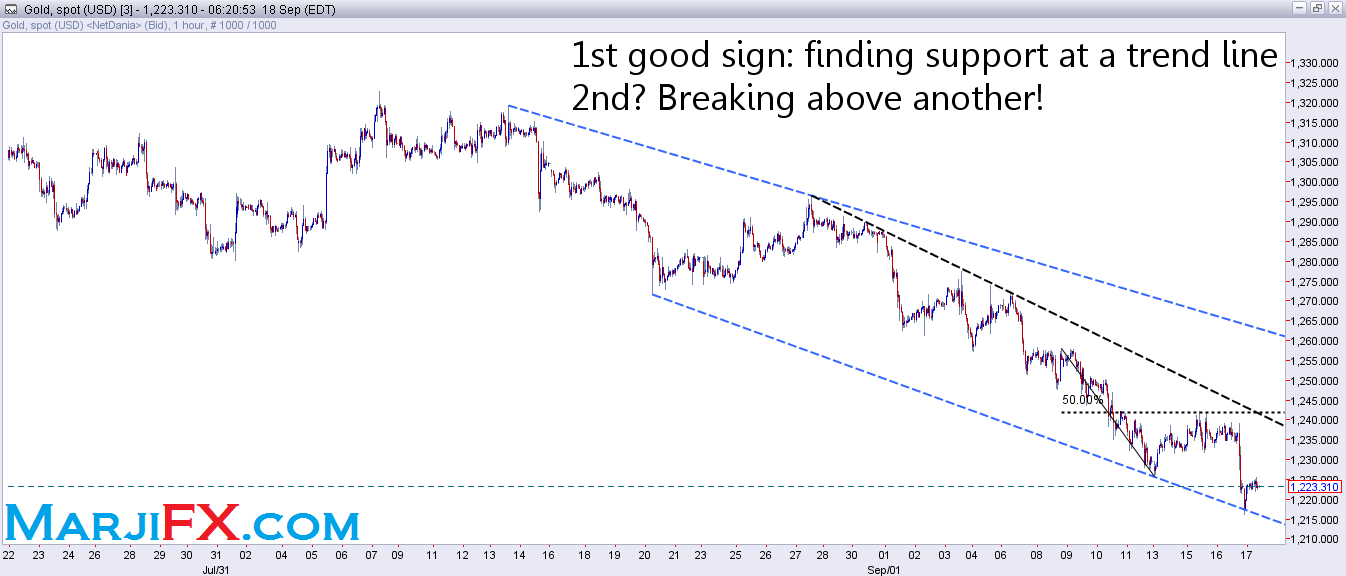
Yesterday’s report predicted a continuation of the downtrend because the price topped at our Fibonacci 50% level, and that was extremely accurate. The price dived to a new 8-month low at 1216.2 during the Asian session.
However, this bearish display of power has stopped where it should, at one of the most important trend lines for this falling trend: the falling trend line from August 21st low. This could be very much read as a bullish sign especially that the price has recovered a little less than a 100 pips from its Asian session bottom. However, if we are to put our trust in the precious metal, this is not enough. While the price is in a downtrend, to take bottoming at support levels alone as a sign to believe in a move in the opposite direction of the main trend is a risky business. It is wise to ask for the price to follow that by breaking a resistance before getting overexcited about a potential recovery.
The first critical resistance level is provided by the falling trend line from August 28th top, which is currently running very close to yesterday’s “FED-high” 1239.4. However, there are closer levels to care about: the micro term level retracements at 1227.8, 1230.5 & 1232.8. A top very close to any of those levels would hurt the outlook, and could mark the end of the recovery from the Asian session low, which means that a new low should be expected. But as we break above each of those levels, the confidence grows, but breaking above 1232.8 is specific is the real key to testing the important 1239.4. A break above this level would be an excellent boost for the recovery scenario. The first target for this break (in case it actually happens) would be 1246.9, followed by a more important target at 1256.4.
As for the support side of the equation, yesterday’s low comes first at 1221.4 but it is a minor level, ahead of the Asian session’s 8-month low 1216.2. Below here the precious metal will be expected to target 1211.6 & 1207.7 ahead of the $1,200 landmark.

Support:
• 1221.4: yesterday's daily low.
• 1216.2: the Asian session's 8-month low.
• 1218.5: January 7th daily low.
• 1211.6: December 3rd 2013 daily low and short term bottom.
• 1207.7: July 4th 2013 daily low.
• 1200.0: psychological level & landmark.
Resistance:
• 1227.8: micro term Fibonacci 50% retracement level, calculated for the move from yesterday’s FED high 1239.4 to today’s Asian session 8-month low 1216.2.
• 1230.5: micro term Fibonacci 61.8% retracement level, calculated for the move from yesterday’s FED high 1239.4 to today’s Asian session 8-month low 1216.2.
• 1232.8: micro term Marji 71.4% retracement level, calculated for the move from yesterday’s FED high 1239.4 to today’s Asian session 8-month low 1216.2.
• 1239.4: an important level which combines the falling trend line from August 28th top, with yesterday’s FED high.
• 1246.9: short term Fibonacci 38.2% retracement level, calculated for the whole drop from August 28th daily high and Fibonacci top 1296.5 to today’s Asian session 8-month low 1216.2.
• 1256.4: short term Fibonacci 50% retracement level, calculated for the whole drop from August 28th daily high and Fibonacci top 1296.5 to today’s Asian session 8-month low 1216.2.
Trend:
• Short term: Down, as long as the price is below 1239.4.
• Medium term: Down, as long as the price is below 1273.5.
• Long term: Down, as long as the price is below 1629.9.
Article originally appeared on MarjiFX.com
