Trading has gotten off on the wrong foot for those who are inclined to prefer the US equity markets and the USD as both are getting pummeled in the face of US economic data, which hasn’t given anyone reason to be optimistic. To start with the bad news, the oft-cited labor release of ADP Employment Change fell down to 189k whereas 227k was expected. Ever since ADP changed their calculation formula to more closely match that of the Bureau of Labor Statistic’s Non-Farm Payroll calculation, more importance has been placed upon it; and the weight of those expectations are making themselves felt in early trade. In addition, the employment measure for ISM Manufacturing dropped down to 50.0 from 51.4, further cementing the belief that Friday’s liquidity strapped NFP could be the first “less-than” release in recent memory.
Encouraging the dour mood in markets are rumors out of Europe that Greece will not be making a bailout repayment to the International Monetary Fund next week without further funds being unlocked for the indebted nation. As a consequence of that news, gold has skyrocketed to take out the 1200 level as fear of further Greek drama has investors seeking the safe-haven asset. Almost as quickly as that rumor came out, though, Greece made a statement denying the rumor. The denial has calmed things down slightly, which has opened the door to a potential counter move in the yellow metal that could take it back down below the 1200 level once again.
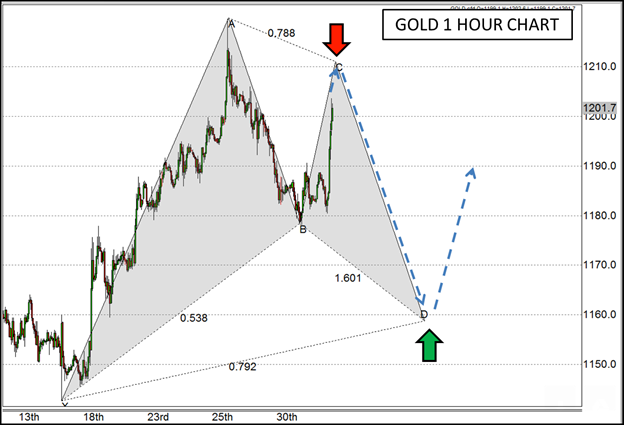
The technical outlook for this commodity could swing either way, though. If you are a gold bug you are likely thinking that anyone who is even thinking of selling gold is a buffoon. But that stance has been beaten down over the last few years despite the easing proclivity of major central banks around the world. If you have been taking advantage of the continuous slide in gold that has been ongoing since 2011, then you are likely looking for opportunities to sell -- and one of those opportunities may be upon us. Right around the 1210 level, there is a 78.6% Fibonacci retracement of last week’s high to this week’s low. And if it were to find resistance there and fall, it could potentially complete a visually compelling, Fibonacci based, Bullish Gartley Pattern around 1160.
Now typically you wouldn’t want to utilize a Gartley pattern until after it has completed, but if you happen to be in the group of traders looking for an excuse to sell gold, an overreaction to a rumor and a Fibonacci level may be just the inspiration you seek. On the other hand, if you are one who would never consider selling gold under any circumstance, a better price to buy may be upcoming if this pattern ends up being the ultimate path.

Source: www.forex.com
For more intraday analysis and trade ideas, follow me on twitter (@FXexaminer ).
