I briefly touched upon Gold’s terrible performance over the last 3 years in the article I posted a few weeks ago titled “Gold’s Performance“. Give it a read and look at the long term performance chart, if you haven’t already. I concluded that over a 3 year rolling period, Gold was at one of the most oversold levels historically.
However, that doesn’t mean the situation cannot and will not get even worse. Let us remember that Gold recorded 12 annual gains in the row into 2012, which was one of the greatest performances by any asset class. The price is now working off those gains by shaking as many bulls as possible, before a sound bottom is made and a new bull market can begin.
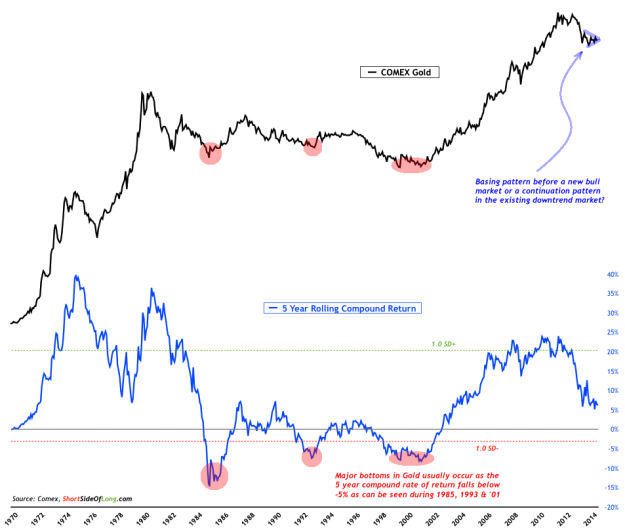
Today I want to share with you a different chart on Gold’s price vs its performance. In Chart 1 we have log scale Gold since 1970 together with a 5 Year Rolling Compound Return indicator. A keen observer should be able to notice that during major bull markets, Gold’s corrections are quite sharp and swift, and the recovery is just as quick. For example, look at various corrections during the 1970s or throughout the early 2000s (including 1976 and 2008). Gold falls sharply and swiftly, and then recovers on a V trough just as quickly, right?
Chart 1: Gold has suffered three major bear markets that lasted 5 years!

On the other hand, observing Gold’s big bad bear markets, one should be able to come to a conclusion that the magic number seems to be around 5 years (give or take a few months here and there). Consider the fact that Gold peaked in 1980 and eventually bottomed in 1985. Afterwards, Gold peaked in 1988 and eventually bottomed in 1993. Finally Gold peaked once again in 1996 and eventually bottomed in 2001.
All of these big bad bears lasted 5 years. Now, does that mean that the current bear market has to last 5 years? No, of course not. It can last 3, 5 or 9 years if it really wants to. Price will decide that and at the end of the day we have to respect the price action. However, my opinion is that it just might get there, or at least close enough to it. Gold peaked in 2011 and the current bear market is now about 3 years old. The recent price action is viewed as a basing pattern by gold bugs, but I personally think it is actually a consolidation / continuation pattern before more downside.
I have maintained for a while now that, while I am extremely bullish on precious metals, the current correction in Gold is most likely not finished yet and a retest of $1,000 per once might occur. This is not a target or a trade expectation, this is just an approximate guess based on major physiological levels and a round number (similar to S&P 2,000 or DAX at 10,000). If Gold was to fall down by a couple of hundred dollars in the next 6 to 12 months, according to the 5 year compound rate of return, we would officially be oversold and a sound bottom could be made.
Disclosure: Let me just say that I hope I am completely wrong and Gold bottoms rather quickly from here onwards and a major rally re-starts. Since I am long PMs, there would obviously be nothing better for my P7L statement. However, hoping isn’t a good strategy in this business, so I am just calling it the way it is…
