Get 40% Off
🤯 Perficient is up a mind-blowing 53%. Our ProPicks AI saw the buying opportunity in March.Read full update

Gold’s Performance; A Historical Look

Published 08/26/2014, 12:54 AM
Updated 07/09/2023, 06:31 AM

Sticking with the precious metals topic, as it seems to be generating a lot of interest. I’ve received a lot of emails, some of which love the content and the charts, some of which totally disagree with ever buying Gold or Silver, and some of which think I’m crazy (those are standard haha).

Before I start, I would like to say that I am not to sure why some people make it a habit of disagreeing in frantic fashion. The point of this blog is to show you what I am doing with my money. If I lose money, it is my own fault and I get poorer, not richer. I am not really giving out financial advice and many of you who have been reading the blog for awhile would have noticed that my favourite line is to win (and also lose) money based on your own research and analysis.

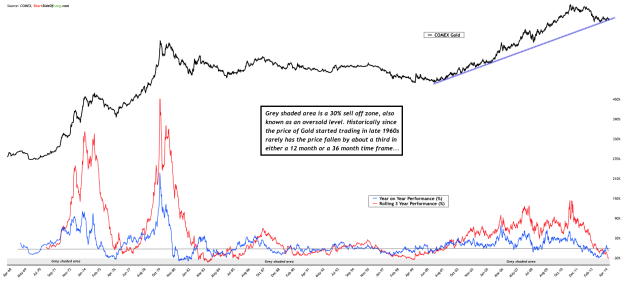
Chart 1: Rarely has the price of Gold fallen by one third over a few years!

Gold Performance

The chart above shows Gold since it floated on the free market exchange in late 1960s, together with a 1 year and 3 year rolling performance. The bottom of the chart has a grey shaded area, which represents an oversold zone. Historically, the price of Gold has rarely fallen by 30% or more over a any Rolling 1 year or 3 year periods. In 2013, Gold just fell by 30% over 12 months and this week markets a three year anniversary of the Gold’s bear market, pushing it into an extremely oversold zone, down 32% in the last 36 months.

3rd party Ad. Not an offer or recommendation by Investing.com. See disclosure here or remove ads .

Several periods that market performance as awful as today were:

  • in middle of 1970s the 1 year rolling performance fell by more then 30%
  • in early 1980s both 1 and 3 year rolling performance fell by almost 40%
  • in middle of 1980s the 3 year rolling performance fell by more then 30%
  • in late 1990s the 3 year rolling performance also fell by more then 30%

All of those occurred at or near major Gold bottoms. Therefore, drawdowns from extremely oversold levels were usually on a smaller scale from a value investors point of view (unlike traders, who think a drawdown of 5% is huge). The indicator marked major bottoms almost immediately in 1976, 1985 and 1999. During the Precious Metals bubble crash of early 1980s, the oversold indicators persistent for longer and initial signals did not work as quickly.

Latest comments

Risk Disclosure: Trading in financial instruments and/or cryptocurrencies involves high risks including the risk of losing some, or all, of your investment amount, and may not be suitable for all investors. Prices of cryptocurrencies are extremely volatile and may be affected by external factors such as financial, regulatory or political events. Trading on margin increases the financial risks.
Before deciding to trade in financial instrument or cryptocurrencies you should be fully informed of the risks and costs associated with trading the financial markets, carefully consider your investment objectives, level of experience, and risk appetite, and seek professional advice where needed.
Fusion Media would like to remind you that the data contained in this website is not necessarily real-time nor accurate. The data and prices on the website are not necessarily provided by any market or exchange, but may be provided by market makers, and so prices may not be accurate and may differ from the actual price at any given market, meaning prices are indicative and not appropriate for trading purposes. Fusion Media and any provider of the data contained in this website will not accept liability for any loss or damage as a result of your trading, or your reliance on the information contained within this website.
It is prohibited to use, store, reproduce, display, modify, transmit or distribute the data contained in this website without the explicit prior written permission of Fusion Media and/or the data provider. All intellectual property rights are reserved by the providers and/or the exchange providing the data contained in this website.
Fusion Media may be compensated by the advertisers that appear on the website, based on your interaction with the advertisements or advertisers.
© 2007-2024 - Fusion Media Limited. All Rights Reserved.