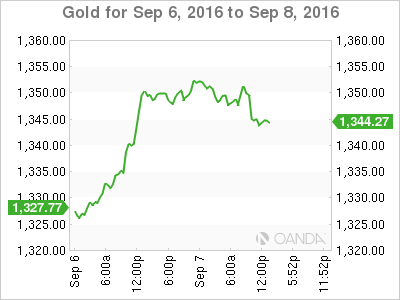
Gold has recorded small losses on Wednesday, as the metal trades at a spot price of $13433.75 per ounce in the North American session. On the release front, JOLTS Job Openings sparkled with a gain of 5.87 million, easily beating the forecast of 5.58 million. On Thursday, the key event is Unemployment Claims.
September has been kind to gold, which as already racked up gains of 2.5 percent. The metal has moved close to the $1350 level, as recent US numbers have not met market expectations, resulting in a reduced likelihood of a September rate hike. The greenback was broadly lower on Tuesday, courtesy of a soft services report, and gold took advantage, posting strong gains of 1.5 percent. ISM Non-Manufacturing PMI, a key gauge of the services sector, fell to 51.4 points, its weakest reading since August 2010. On the job front, the robust US labor market hit a bump in August, as US employment numbers were dismal on Friday. Nonfarm Payrolls plunged to 151 thousand in August, down from 255 thousand a month earlier. This was well short of the forecast of 180 thousand. Wage growth also disappointed, as Average Hourly Earnings edged lower to o.1%, shy of the forecast of 0.2%. The CME FedWatch tool is showing a substantial drop in the odds of a rate hike for both September and December – the likelihood of a September rise is at 19%, while the odds of a December hike are down to 39%. Even though the US labor market remains close to full capacity, many FOMC members remain uneasy about a rate hike, especially given the persistent lack of inflation in the economy. Key inflation indicators will be released in mid-September, just before the Fed policy meeting on September 21. These releases could play a critical role in determining if the Fed presses the rate trigger this month, or decides to revisit the rate question in December, exactly a year from the last rate hike.
XAU/USD Fundamentals
Wednesday (September 7)
- 10:00 US FOMC Member Esther George Speaks
- 10:00 US JOLTS Jobs Openings. Estimate 5.58M. Actual 5.87M
- 10:00 US Beige Book
Thursday (September 8)
- 8:30 US Unemployment Claims. Estimate 264K
*Key releases are highlighted in bold
*All release times are EDT
XAU/USD for Wednesday, September 7, 2016

XAU/USD September 7 at 12:30 EDT
Open: 1349.04 High: 1352.61 Low: 1342.71 Close: 1344.08
XAU/USD Technicals
| S3 | S2 | S1 | R1 | R2 | R3 |
| 1279 | 1307 | 1331 | 1361 | 1388 | 1416 |
- XAU/USD was flat in the Asian and European sessions. The pair has posted small losses in North American trade
- 1331 is providing support
- There is resistance at 1361
- Current range: 1331 to 1361
Further levels in both directions:
- Below: 1331, 1307, 1279 and 1245
- Above: 1361, 1388 and 1416
OANDA’s Open Positions Ratio
XAU/USD ratio is showing long positions with a sizable majority (58%), indicative of trader bias towards XAU/USD reversing directions and moving upwards.
