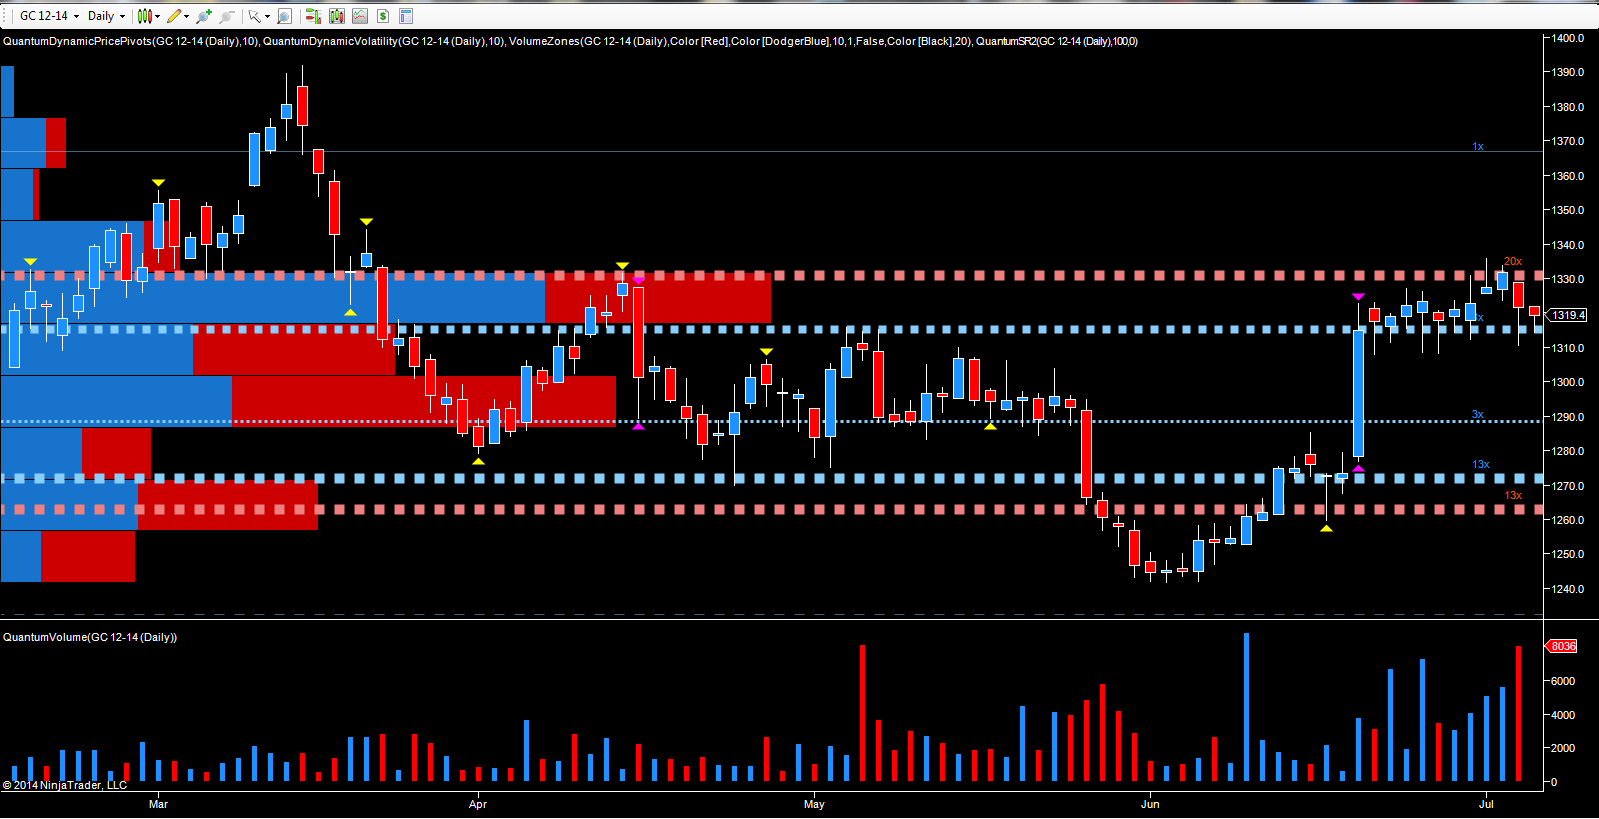
Gold is now coming under increasing pressure, not only from a technical perspective, but also from a fundamental one, with the ramifications of the London gold fix allegations now starting to take hold. Indeed, there are now suggestions that this arcane process may even be abandoned as the recent heavy fines for Barclays (NYSE:BCS) (and potentially others) start to bite.
The gold fix has been in place for almost a century and is basically the ‘gold bullion benchmark price’ for everyone (from jewellers to central banks) to trade and value gold. As an adjunct to this, the silver fix is already set to be scrapped later this year following Deutsche Bank's (NYSE:DB) resignation from the benchmark setting process earlier this year. As many in the industry have already suggested, the gold fix is very easy to manipulate and is not a particularly valid or meaningful benchmark anyway.
From a technical perspective, and as pointed out in previous posts, the rally for gold in June is increasingly taking on the mantle of a trap up move with the precious metal now consolidating and moving lower once again on Globex. Last week’s price action, in a holiday shortened week, was characterized by significantly rising volume, but with no appreciable move higher for the metal. The price action on the 1st July was a classic example, with high volume coupled with a shooting star candle, reinforced by the strong resistance level firmly in place at the $1330 per ounce price region. This duly held on into 2nd July with even higher volume failing once again to penetrate this level, with the narrow price action sending yet further confirmation of weakness.
The precious metal duly sold off on the 3rd of July on ultra high volume and although the lower wick of that day’s candle suggests a modicum of support at this level, nevertheless this is once again evidence of strong selling pressure coming into the market.
At the time of writing, the December gold futures contract is trading lower once again at $1315.30 per ounce. The key now is the deep level of support at this price point which is clearly defined both by the volume at price histogram to the left of the chart, and also the solid blue dotted line immediately below.
As you can see from the chart, this level has already been tested on at least 8 occasions and has held firm thus far. However, if this is breached, expect to see gold test the weaker level below at $1290 per ounce. Any move through there would take the precious metal back down to $1270 and potentially lower still. As always, volume will confirm the strength of any move and the validity of any breakout from the current congestion phase.
