Until Friday, Gold had an uneventful week, moving back and forth and at two points retesting its old short term resistance level, which served as new support as was to be expected. Then disappointing home sales data were released on Friday, upon which gold moved sharply higher. As a result, the next short term resistance area ($1,400 to $1,425) has come into view. One thing that could be learned from the action is that the gold price continues to be highly sensitive in the short term as to whether economic data releases are deemed to be weak or strong. What drives this behavior are beliefs about likely future central bank policy (weaker data are held to lengthen the sell by date of ‘QE’).
However, we continue to believe that unless a new Volcker suddenly pops up (likelihood = near zero), this will ultimately prove irrelevant to the gold price. The negative effects of the monetary pumping to date have yet to fully express themselves and when they do, gold is unlikely to sit still.
In the short term, the above mentioned price area is likely to offer resistance similar to the previous short term resistance level at $1,350, which had to be tackled several times before giving way. Sentiment and positioning continue to support the rally, as neither are anywhere near an extreme as of yet.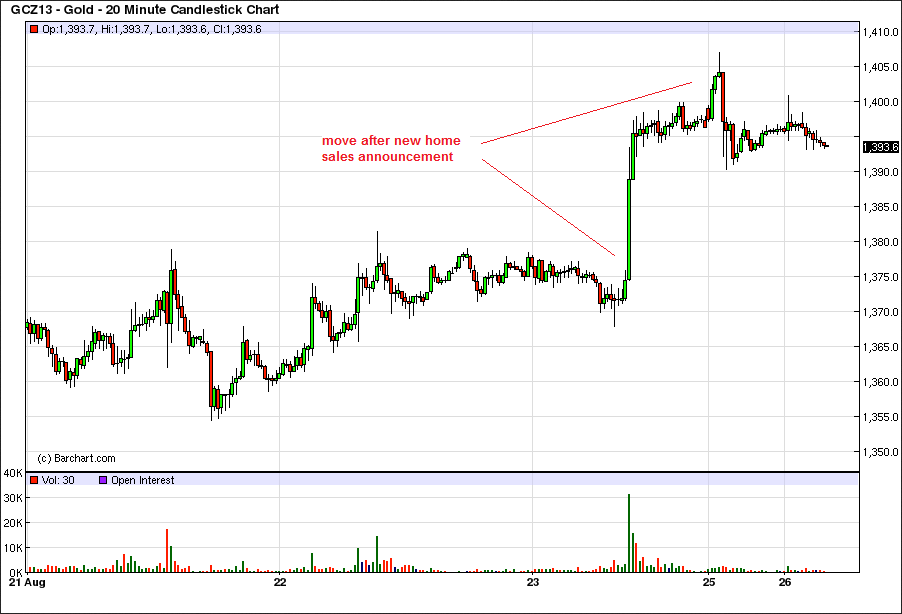
Gold, December contract, 20 minute candles. There were two tests of the new support level last week (the lowest point was reached on August 20, which is not included in this chart), followed by the sharp move to the next resistance level on Friday.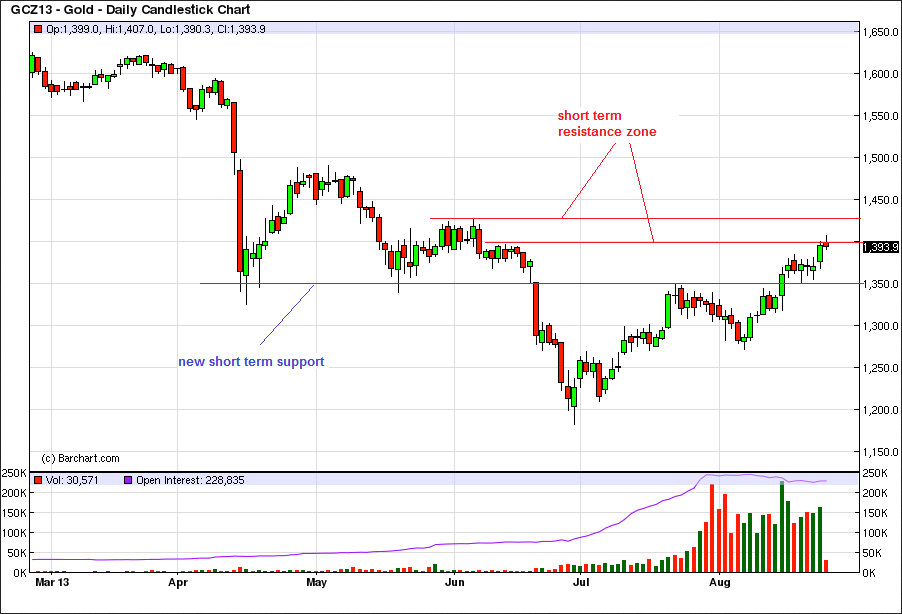
A daily chart of the December futures contract depicting the short term horizontal support/resistance zones. Gold is now back in the lower portion of the price area of the April crash.
Gold Stocks Hesitate
Gold stocks failed to lead gold last week and weakened slightly relative to it. However, that may partly be due to the fact that they have rallied quite a bit from the lows. This has invited both profit taking and short selling on a truly vast scale as recent data from the TSX in Canada show. For an overview of the increase in short positions of selected gold miners, see this document (pdf).
Anyway, the HUI-gold ratio reflects this moment of hesitation – and this is a divergence that needs to disappear for the bullish case to remain intact. Such divergences may not necessarily be meaningful in the medium term, but per experience they do tend to be a fly in the ointment at least in the short term. If the divergence persists, it will become a concern, but keep in mind that there are historical precedents for this that did not get resolved bearishly (namely, the 1970s bull market). Over the past few years however, such divergences have invariably warned of impending weakness in the sector.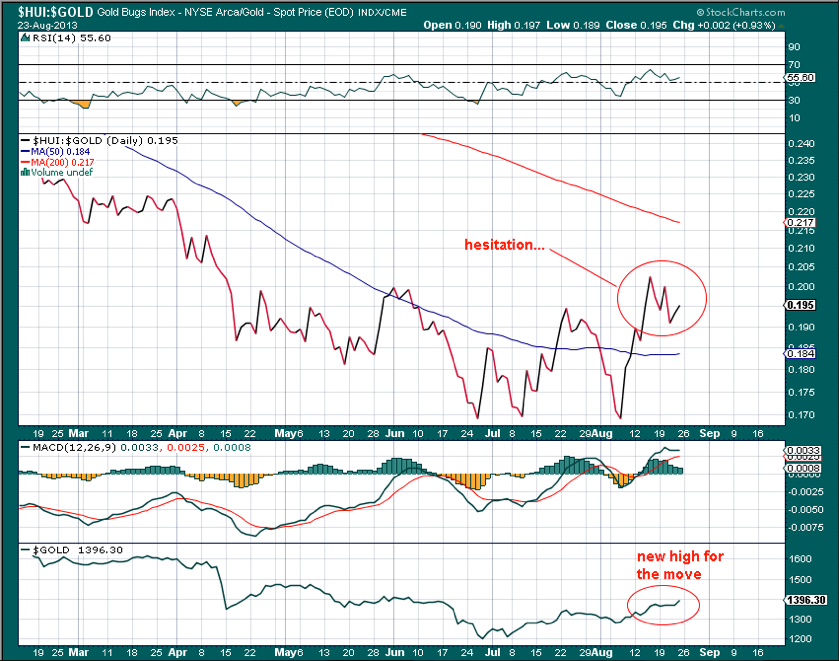
The HUI – gold ratio was trailing the gold price last week (gold is the green line at the bottom of the chart).
The Plight Of South Africa’s Gold Mines
Relative to gold, almost all gold stocks are still trading at a very low level, but nowhere is the discrepancy more pronounced than in South Africa, where competing and quite militant mine workers unions are currently haggling over wage increases with the Chamber of Mines. The marginal South African mines simply cannot afford to give in to their demands. In Rand terms, gold is actually back at its 2011 high (!), reflecting the recent collapse of the Rand. And yet, stocks like Harmony Gold are still trading some 80% below the level they inhabited at the time.
Incidentally, it seems highly likely that the mine workers unions will call for a strike this week. Their demands are so far away from what the mining houses can offer that a confrontation seems inevitable. The unions are demanding wage increases ranging from 60% to up to 150% at the entry level, which is patently absurd; the mines are offering one tenth of these percentages.
Deep level gold mining is set to continue its inexorable decline in South Africa. Eventually, all these mining jobs will be gone and only surface tailings treatment plants will remain. These plants have the advantage that they require only a minimal labor force, which is likely to keep the unions from getting involved (there’s no mileage in lording it only over a handful of workers). In that sense, operations like Durban Deep (DRD, a pure-play gold tailings processor these days) continue to represent superior value.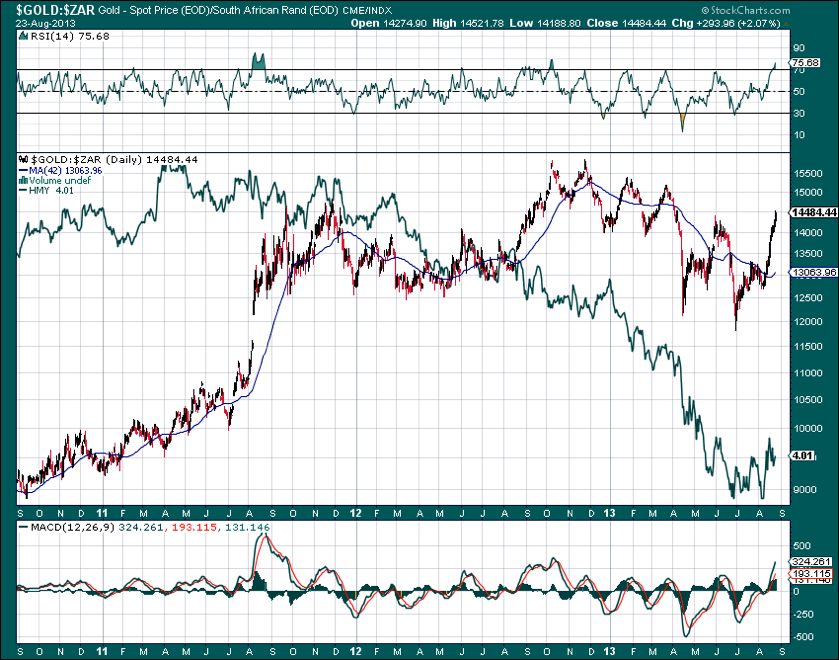
The Rand gold price versus the stock price of Harmony (HMY, the green line). In Rand terms, gold is nearly back at its 2011 high, as the Rand has suffered a free-fall this year – click to enlarge.
Conclusion
It seems likely that there will be some backing and filling this week, but a move to the upper rail of the resistance area cannot be ruled out. If the resistance zone is overcome quickly, it would be another sign that the gold market is regaining its footing. Eventually, the major resistance at the $1,530 to $1,550 level should be tested. Gold stocks need to begin to lead gold again, as their failure to do so last week is a mild concern.
- English (UK)
- English (India)
- English (Canada)
- English (Australia)
- English (South Africa)
- English (Philippines)
- English (Nigeria)
- Deutsch
- Español (España)
- Español (México)
- Français
- Italiano
- Nederlands
- Português (Portugal)
- Polski
- Português (Brasil)
- Русский
- Türkçe
- العربية
- Ελληνικά
- Svenska
- Suomi
- עברית
- 日本語
- 한국어
- 简体中文
- 繁體中文
- Bahasa Indonesia
- Bahasa Melayu
- ไทย
- Tiếng Việt
- हिंदी
Gold Strength Bumps Next Resistance
Published 08/26/2013, 02:13 PM
Updated 07/09/2023, 06:31 AM
Gold Strength Bumps Next Resistance
Friday Strength Brings Gold To Next Important Level
3rd party Ad. Not an offer or recommendation by Investing.com. See disclosure here or
remove ads
.
Latest comments
Install Our App
Risk Disclosure: Trading in financial instruments and/or cryptocurrencies involves high risks including the risk of losing some, or all, of your investment amount, and may not be suitable for all investors. Prices of cryptocurrencies are extremely volatile and may be affected by external factors such as financial, regulatory or political events. Trading on margin increases the financial risks.
Before deciding to trade in financial instrument or cryptocurrencies you should be fully informed of the risks and costs associated with trading the financial markets, carefully consider your investment objectives, level of experience, and risk appetite, and seek professional advice where needed.
Fusion Media would like to remind you that the data contained in this website is not necessarily real-time nor accurate. The data and prices on the website are not necessarily provided by any market or exchange, but may be provided by market makers, and so prices may not be accurate and may differ from the actual price at any given market, meaning prices are indicative and not appropriate for trading purposes. Fusion Media and any provider of the data contained in this website will not accept liability for any loss or damage as a result of your trading, or your reliance on the information contained within this website.
It is prohibited to use, store, reproduce, display, modify, transmit or distribute the data contained in this website without the explicit prior written permission of Fusion Media and/or the data provider. All intellectual property rights are reserved by the providers and/or the exchange providing the data contained in this website.
Fusion Media may be compensated by the advertisers that appear on the website, based on your interaction with the advertisements or advertisers.
© 2007-2024 - Fusion Media Limited. All Rights Reserved.