In the Western gold community, there seems to be a fairly widely held view that gold prices can’t rise much higher, unless confidence in central banking is lost.
I beg to differ. Investors who bet against central banks generally don’t fare very well. The 2008 crisis saw the Fed use some of its tools, but not all of them. The Fed’s most powerful tools, gold revaluation and money printing, were never employed in that crisis.
Until the Fed has used all its most powerful tools, and those tools have clearly failed, a “loss of confidence” event that creates massive gold buying is highly unlikely.
What is likely in 2015, is that the bond market won’t crash, but will modestly decline, as the Fed raises interest rates later this year, in a calm and rational manner.
It’s important to understand the effect on the US economy of absolute changes in bond yields, versus relative changes in yields.
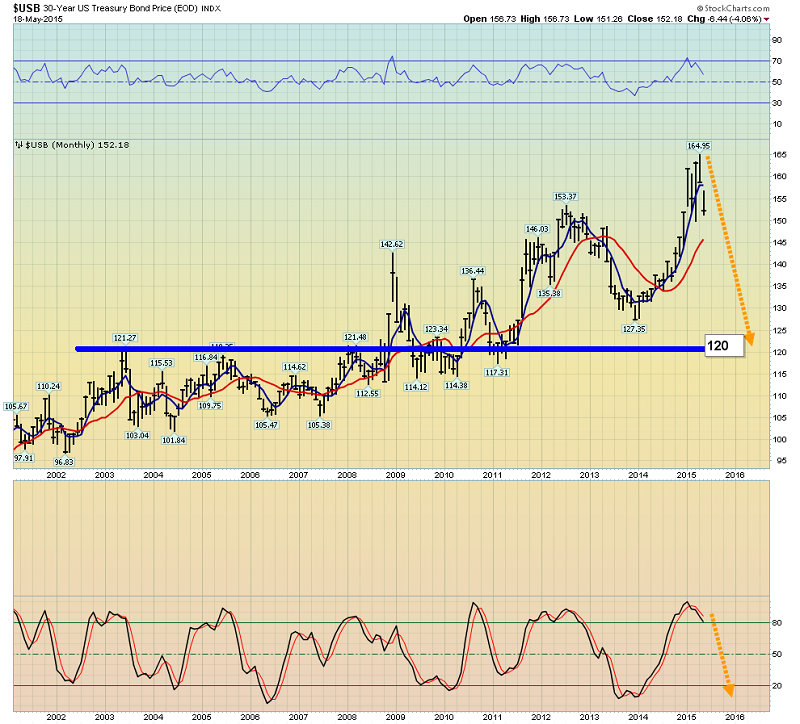
That’s the monthly T-bond chart. I would expect to see T-bonds decline toward the 120 area by 2016.
The dollar is unlikely to rally much as bonds decline, because the rate hikes will provide incentive to commercial banks to increase their loan activity, increasing money velocity.
That increase in velocity will produce a noticeable rise in inflation, putting upwards pressure on commodity prices and downwards pressure on the dollar.
The upwards pressure from rate hikes and downwards pressure from inflation should produce sideways to lower price action in the dollar. At a price of 120, absolute T-bond yields are still historically low, but the large spread between loan and deposit rates at that price would create enormous profits for the banks, and noticeably higher inflation.
Even without factoring in the staggering growth of the Chindian love trade, gold should be generally well supported…just by the US inflation created by heightened bank loan activity.
Analysts who are trying to use the 1970s gold bull market as a “template” for the current period of time are probably making a horrific error. Unlike the late 1970s and early 1980s timeframe, when the Fed used dramatic rate hikes to curtail inflation, the Fed will now use modest rate hikes to create inflation.
Heightened bank loan activity can extend the business cycle. QE4, if used to fund government infrastructure spending, can be inflationary, but if the next crisis is severe, only gold revaluation will work to end it.
Gold trades mainly in dollars, so it doesn’t have to be the US central bank that orchestrates a gold price revaluation. I expect the next global super-crisis to be resolved by a PBOC (Chinese central bank) publicly announced gold buy program. It could be announced even before the next crisis occurs, to prevent it from happening.
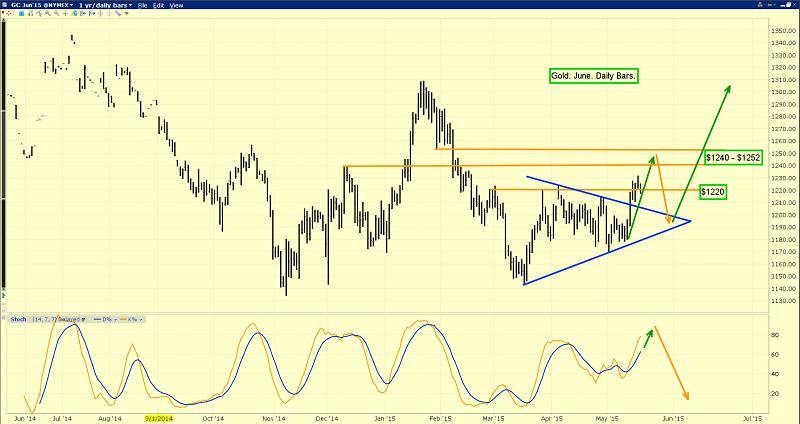
This daily gold chart looks good. Gold clearly penetrated resistance at $1220 yesterday, with a spike to the $1232 area.
Unfortunately, the current rally is getting “long in the tooth”. Note the lead line of my key 14,7,7 Stochastics oscillator, at the bottom of the chart. It’s close to the overbought zone at 80. Gold has rallied about $80 since that oscillator bottomed.
I’m open to a minor trend surge to the $1240 - $1252 area, before the gold community has to feel some price pain. Light profits need to be booked into this strength.
When gold does decline, albeit in a minor way, I expect numerous gold stocks to rally throughout the sell-off. That’s because more and more institutional investors are embracing the idea that Janet Yellen will be successful in her reflationary mission.
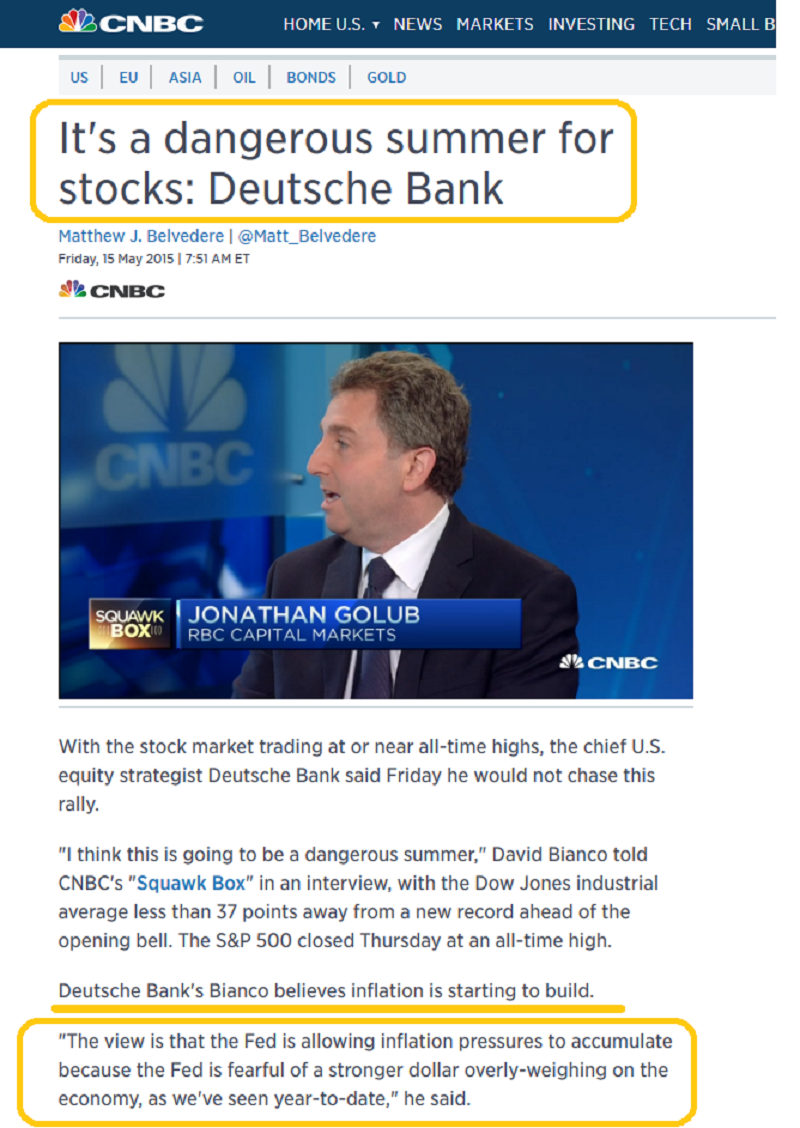
Clearly, top economists and analysts at major banks are not betting against Janet and her reflationary mission! That’s good news for gold stocks and bad news for the general equity markets.
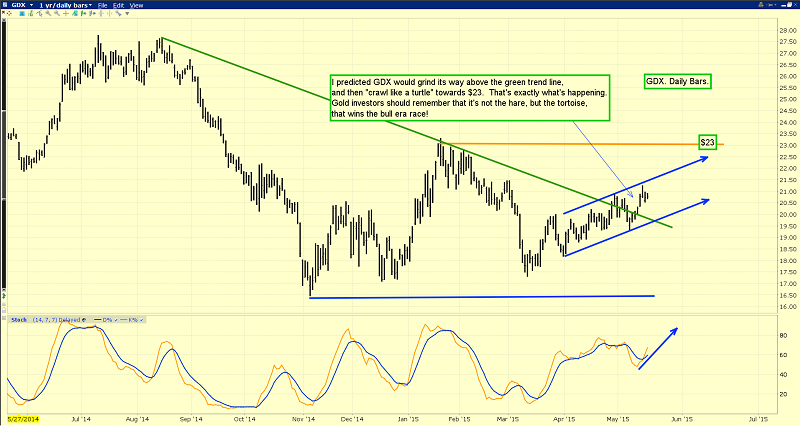
That’s the (ARCA:GDX) daily chart picture, and I certainly think it speaks a thousand “bull era” words. Unlike most analysts, I think GDX and most gold stocks will display this type of upwards price grind for not just weeks or months to come, but for many years and probably for several decades.
That’s because gold is driven by three key themes now; Indian demand that is in its earliest stages of massive growth, Chinese gold market infrastructure growth, and US reflation. Simply put, there’s never been a better time in history to own gold stocks, from both a risk and reward standpoint.
Key individual gold stocks are leading the gold stock indexes higher.
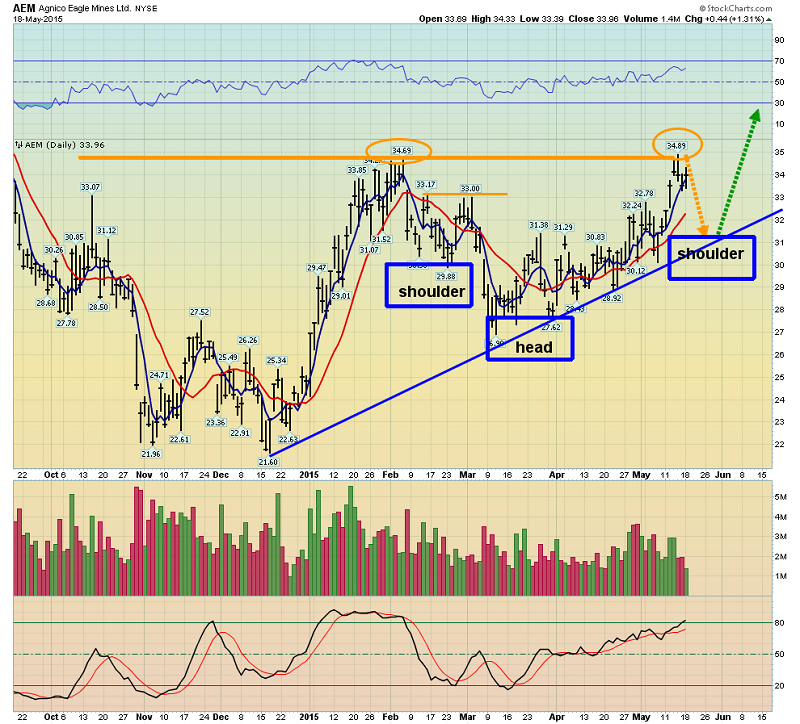
That’s the daily chart for Agnico Eagle Mines Limited (NYSE:AEM). When the fear trade (system risk) dominated price discovery for gold stocks, the “Eagle” soared, and then crashed. In the love trade era, fuelled by Chindian jewellery demand and modest US reflation, I expect Agnico to glide higher steadily, rather than soar or crash.
Outrageous returns can be produced by this kind of “stealth rise” in the price of a gold stock, particularly when the rise in price is relentless. A pullback to the blue uptrend line would be normal after the recent price advance, but a successful breakout above the $35 area is likely imminent.
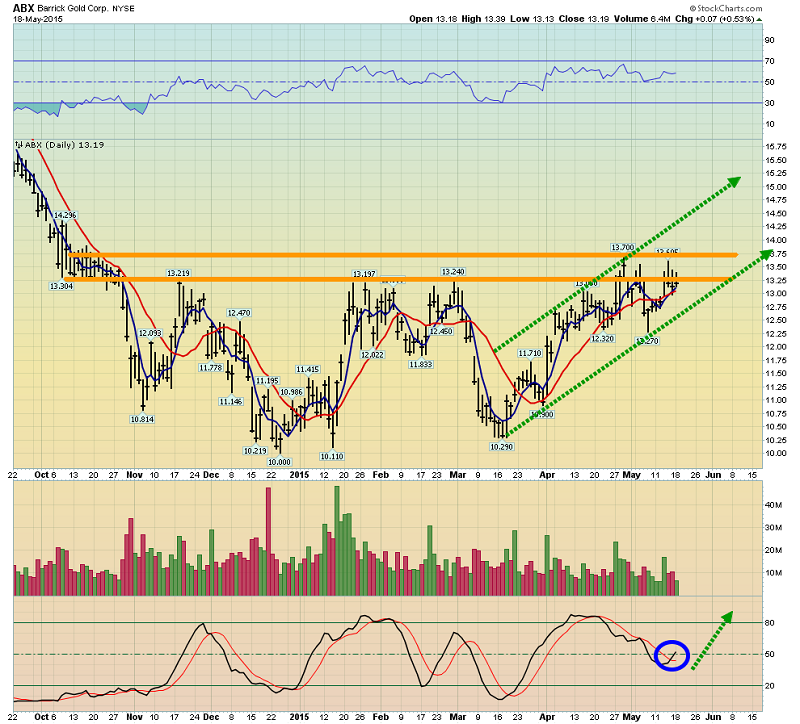
This daily chart of Barrick Gold (NYSE:ABX) looks spectacular. Investors need to “kick their fears to the curb”and boldly buy this stock on all two and three day pullbacks in the current price area.
There’s a chance of a bigger pullback toward $11, but the odds of that happening are fading. A two-day close above $13.70 should herald a much stronger advance, towards the $20 area!
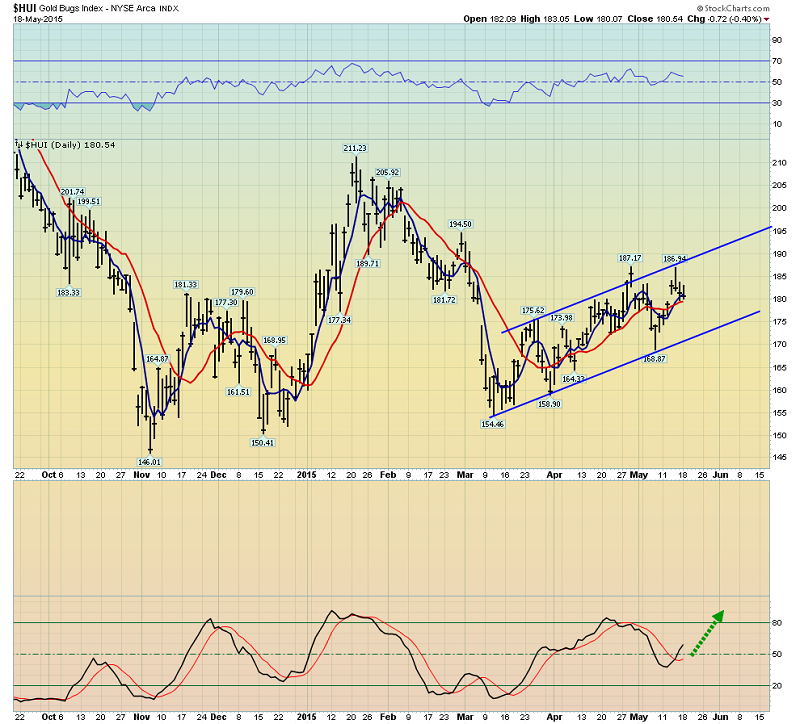
That’s daily ARCA Gold BUGS chart, a widely-followed gold stocks index. Note the nice position of the 14,7,7 Stochastics series, and the gentle rising price channel. The HUI index is a great golden tortoise, plodding her way to much higher prices!
Thanks!
CheersStewart Thomson is a retired Merrill Lynch broker. Stewart writes the Graceland Updates daily between 4am-7am. They are sent out around 8am-9am. The newsletter is attractively priced and the format is a unique numbered point form. Giving clarity of each point and saving valuable reading time.
Risks, Disclaimers, Legal
Stewart Thomson is no longer an investment advisor. The information provided by Stewart and Graceland Updates is for general information purposes only. Before taking any action on any investment, it is imperative that you consult with multiple properly licensed, experienced and qualified investment advisors and get numerous opinions before taking any action. Your minimum risk on any investment in the world is: 100% loss of all your money. You may be taking or preparing to take leveraged positions in investments and not know it, exposing yourself to unlimited risks. This is highly concerning if you are an investor in any derivatives products. There is an approx $700 trillion OTC Derivatives Iceberg with a tiny portion written off officially. The bottom line:
Are You Prepared?
