Over the last few days, different friends emailed a few different charts, all focusing on the oversold condition of the precious metals sector. Since I did not discuss any of these charts in my recent newsletter, I thought it would be appropriate to share them now. Instead of a "Chart Of The Day" post, today we are going through many "Charts" of the day, so let us begin:
Chart 1: According to yearly performance, Gold is its most oversold ever! 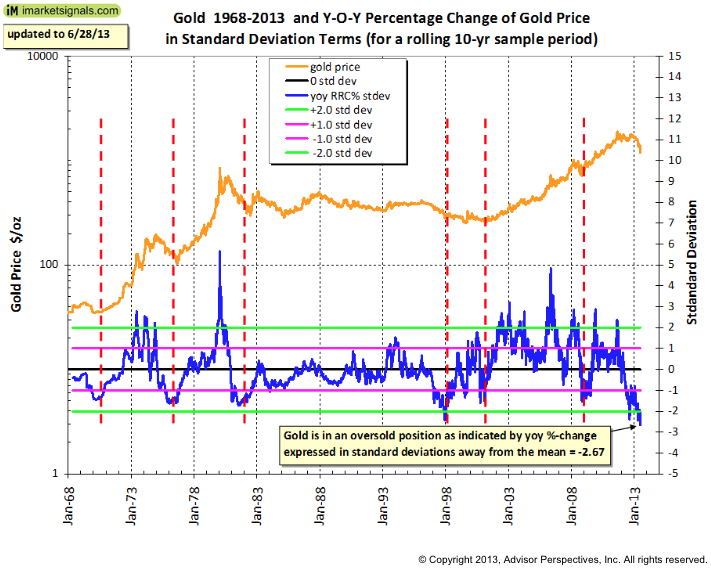
Regular readers should know by now that I consistently track annualised performance of various asset classes. This indicator is commonly referred to via the 12 month rate of change or a yearly rolling performance. The first chart we are focusing on, above, shows that the current Gold correction is the most oversold its ever been (Gold started trading freely on COMEX in early 1970s). The corrections of 1971, 1976, 1982, 2001 and 2008 were all sharp, with price having fallen almost 2 standard deviations away from its average annualised percentage movement.
In 1999, Gold became so oversold that the price moved over 2 standard deviations away from its mean. That became known as a secular bear market bottom and offered one of the greatest buying opportunities over the past decade. Fast forward to today, and what is even more interesting is the fact that Gold has now become the most oversold ever, even superseding those 1999 conditions. On the daily basis, as Gold traded below $1200 per ounce in recent weeks, the price was almost 3 standard deviations away from its annualised mean. What we have here, is one of the most important contrarian "buy signals" in the precious metals sector over the last 50 years!
Chart 2: Gold miners hold similarities to the greatest oversold conditions 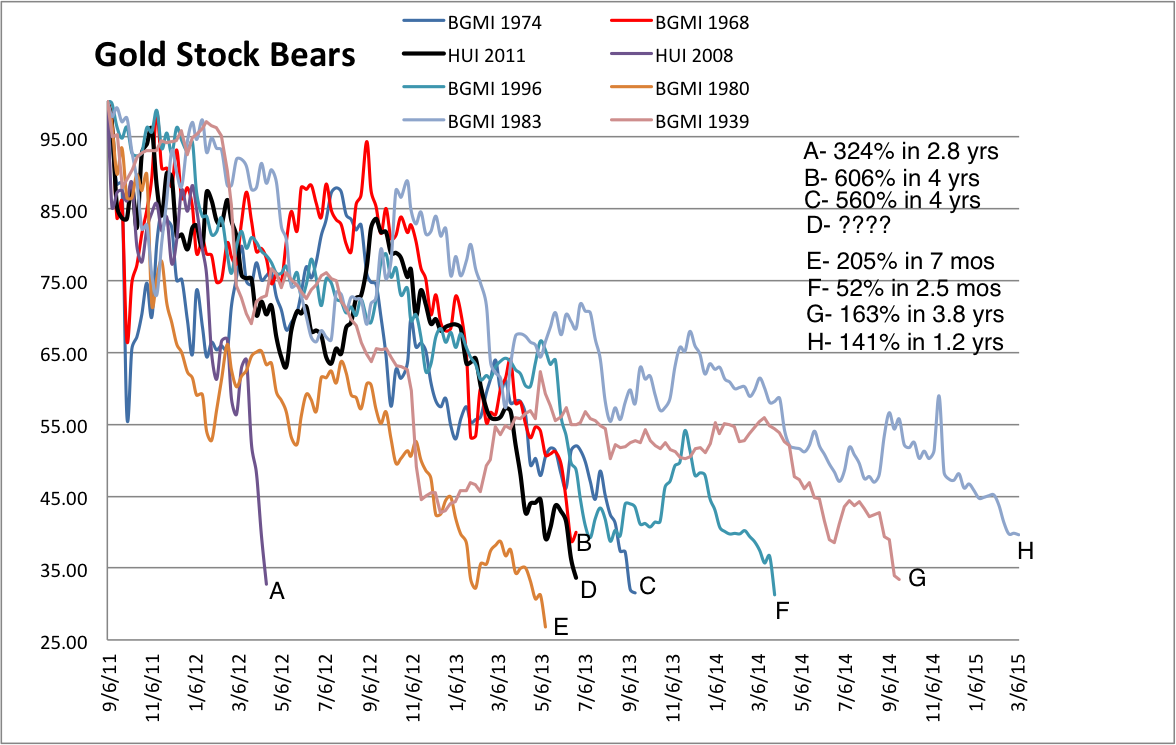
Another friend of mine, who runs a great precious metals newsletter over at The Daily Gold, recently sent me a chart of Gold Mining equities that he compiled dating back to 1930s. Essentially, the chart shows that regardless of whether Gold is in a secular bull or a secular bear market, the sharpest corrections over the last 80 years have averaged about 65% on the downside.
From there, various observations can be made. Personally, the current correction (labeled D) is one of the strongest out of 8 major sell-offs since 1939. We are more then 65% down from the all time highs (just about the average for all the others too), but more importantly, corrections are not only measured in percentages, but also in time.
With that in mind, we can easily see that the current correction is one of the sharpest, only third behind the infamous crash of 1980 (the end of the secular bull) and the global financial crisis of 2008 (Lehman panic). Observing the chart above and taking into context the historical price action comparison, we could assume that Gold Miners are either near or at a major low as we speak.
Chart 3: South African mining industry has now in total disarray 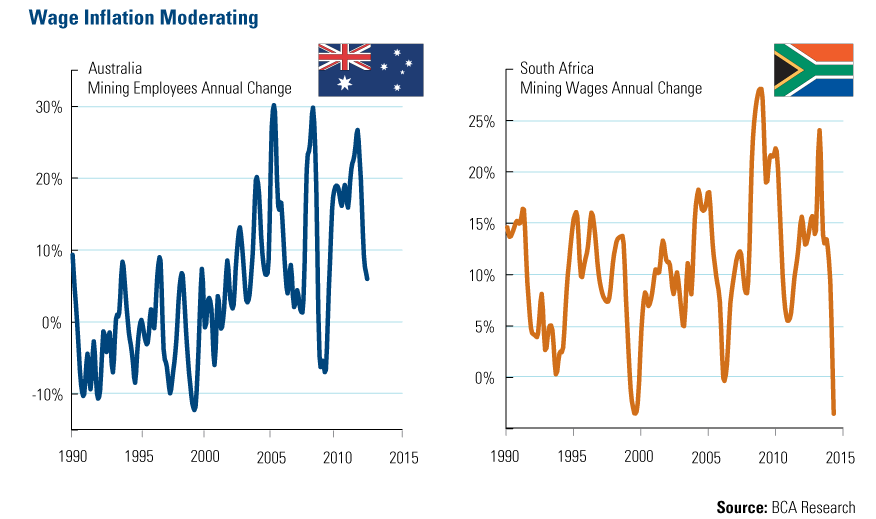
Wage inflation and general employment conditions are usually a favourite tool of economists and Wall Street analysts. Those guys (and girls) love to follow lagging data to tell us how good (or bad) the current conditions are. However, as contrarian investors, we have to remember that markets are usually discounting future events and fundamental conditions today, and at times look forward 6 to even 12 months in front of what the current data says. As I always say, investing is about anticipating the future.
South Africa is traditionally known for its strong precious metals industry and high global exports. If we look at the chart above, the current employment conditions have reached dreadful levels. Previous similarities can be seen during 1993, 1999 and 2006 downturns. As mining conditions deteriorate, the supply that was planned for the future usually does not come on board (just as we saw in 1999), so the market starts discounting up-and-coming shortages. Therefore, current conditions could be forecasting another major contrarian buying opportunity.
Interestingly enough, looking at the South African annual mining wage change and comparing it to the price, we can see how Gold (and other precious metals) tend to find a bottom just as conditions turn awful. Consider the fact that in 1993, 1999 and 2006 Gold found major bottoms out of which it rallied powerfully, so I would not be surprised at all that we are nearing another major low as we speak.
What I Am Watching
- English (UK)
- English (India)
- English (Canada)
- English (Australia)
- English (South Africa)
- English (Philippines)
- English (Nigeria)
- Deutsch
- Español (España)
- Español (México)
- Français
- Italiano
- Nederlands
- Português (Portugal)
- Polski
- Português (Brasil)
- Русский
- Türkçe
- العربية
- Ελληνικά
- Svenska
- Suomi
- עברית
- 日本語
- 한국어
- 简体中文
- 繁體中文
- Bahasa Indonesia
- Bahasa Melayu
- ไทย
- Tiếng Việt
- हिंदी
Gold Now Sending Out Significant Contrarian Buy Signals
Published 07/11/2013, 06:56 AM
Updated 07/09/2023, 06:31 AM
Gold Now Sending Out Significant Contrarian Buy Signals

Tiho Brkan
3rd party Ad. Not an offer or recommendation by Investing.com. See disclosure here or
remove ads
.
Latest comments
Install Our App
Risk Disclosure: Trading in financial instruments and/or cryptocurrencies involves high risks including the risk of losing some, or all, of your investment amount, and may not be suitable for all investors. Prices of cryptocurrencies are extremely volatile and may be affected by external factors such as financial, regulatory or political events. Trading on margin increases the financial risks.
Before deciding to trade in financial instrument or cryptocurrencies you should be fully informed of the risks and costs associated with trading the financial markets, carefully consider your investment objectives, level of experience, and risk appetite, and seek professional advice where needed.
Fusion Media would like to remind you that the data contained in this website is not necessarily real-time nor accurate. The data and prices on the website are not necessarily provided by any market or exchange, but may be provided by market makers, and so prices may not be accurate and may differ from the actual price at any given market, meaning prices are indicative and not appropriate for trading purposes. Fusion Media and any provider of the data contained in this website will not accept liability for any loss or damage as a result of your trading, or your reliance on the information contained within this website.
It is prohibited to use, store, reproduce, display, modify, transmit or distribute the data contained in this website without the explicit prior written permission of Fusion Media and/or the data provider. All intellectual property rights are reserved by the providers and/or the exchange providing the data contained in this website.
Fusion Media may be compensated by the advertisers that appear on the website, based on your interaction with the advertisements or advertisers.
© 2007-2024 - Fusion Media Limited. All Rights Reserved.