When back in 1851 Stephen Foster penned into the song "The Old Folks at Home" the lyric "Way down upon the Swanee River", 'tis doubtful he was clairvoyantly discerning the disturbing market event of some 157 years hence in 2008, (especially given the correct spelling for the Floridian river is "Suwannee"). However, the infamy of such event is that, save for the Dollar, everything went down.
We hasten to point this out, as 'tis not just Gold that's back on the skids of late, for rather once again, save for the Dollar, everything is down. The only missing elements this time 'round are the ferocious velocity and range by which our BEGOS Markets were beaten down some six years ago. Still, we commence with the following chart of these eight markets showing their bars for the past 21-trading days, their respective diagonal linear regression trendlines, and accompanying baby blue dots that define trend consistency:

To be sure, the trendline for the S&P 500 ("Spoo") is the only one presently tilted up, but if 'twas animated, 'twould be rapidly rotating 'round toward the downside as both the price bars and "Baby Blues" now appear as would a massive wave off the north shore of Oahu about to crash upon Sunset Beach. Moreover, if anything in the above graphic ought be pitied, look at Sister Silver, her own blue dots already smashed into the sand. More on her sagging saga in a bit. Let's first focus on Gold.
The price of Gold on balance continues to be bid down since its mid-July peak price of 1346, settling yesterday (Friday) at 1229, its last having traded at that level in early June. Arguably attributable to the oxymoron known as "Dollar strength", there is no question that some of the most rudimentary technical measures have been drawing sellers into the market. Be it classic "MACD" (moving average convergence divergence) measures crossing negatively, or regression trends tilting down, or even the fizzling rallies we've too often observed during the parabolic Long trends as displayed below across our one-year chart of Gold's weekly bars, negativity begets selling and upside price simply runs out of puff, indeed so much so that the 1280-1240 support zone bounded by the purple lines has now been completely hoovered:

'Twas a mere two weeks ago that we presented the mathematical calculation to establish that the price of Gold today based on StateSide M2 currency debasement from 1980 onward -- including diluting price to account for a rising supply of Gold throughout -- "ought be" $2,077/oz. Instead here at $1,229/oz., Gold is valued by the market at just 59% of that calculation's result. What gives?
We understand the way the trading mechanism works: a seller hits the underlying bid(s) in what is known as a market's "depth" and the price shifts lower. The question is: who is doing the selling? Our delving into such discovery specific to this instance is purely unscientific, i.e. 'tis rather by observation than by embarking upon a mission to mine the actual data. But let's just ask some basic questions.
Are the Chinese selling? No. Oh, they have perhaps periods of quietude following buying frenzies, but on balance they're hardly net sellers of Gold. What about India? Hardly. Oh, they've the usual pushing and shoving about of their jewelry business and so forth, but you can bet your bottom rupee that Gold is not leaving India. Therefore we turn to the sovereign banks: are they unloading Gold? Absolutely not. Moreover, some are seeking to repatriate it. Oh, the sovereigns are "QE"-quirky, caught up in the debasing elixir of recent years, but hardly are they "stoopid". Remember one official's response when asked during the lurid proceedings of the StateSide "sequester" if it could be buffered by the Treasury selling some of its Gold? To paraphrase: "No, you don't go there."
That pretty much leaves two remaining parties. One is called the public. Are they driving the Gold selling? Obviously impossible: they don't own any. "Putting on shorts" to them means going to the beach. Therefore the process of elimination leads to this final group of like entities: those with the gumption to sell that which they don't actually own and who in turn must later rely upon their agility to escape before being obligated to produce the metal itself. You yourself don't need to be a Holmes nor Smiley nor Bond to zoom about the web and see charts and data on "short interest" in Gold. I just peeked at the CFTC's Commitments of Traders stats as of 05 September: the "Producer/Merchant/Processor/User" and "Swap Dealers" categories are both 2-to-1 Short. Such volatile rocket fuel 'tis, the offsetting net Long positions held by money managers and so forth notwithstanding. But based on our calculation for Gold $2,077/oz. as of two weeks ago, one's being Short at these lowly levels seems overwhelmingly short-sighted.
Nonetheless, when a precious few own the precious metal, the picture is hardly pretty. Here is Gold's track year-to-date along with its 300-day moving average. View chart, emit groan:

Yet try this out for irony: recall from last week's missive the year-to-date "standings" of the eight BEGOS Markets' performances wherein Gold was in third place? It still is, despite falling 3% since then, simply because everything else as noted at the outset is also falling. Misery may love company, but given Gold's "undervaluation" vis-à-vis currency debasement, this is getting a bit ridiculous. Oh, I realize of course, 'tis "Nuthin' But Buck!" Here's its last 28 years-to-date:

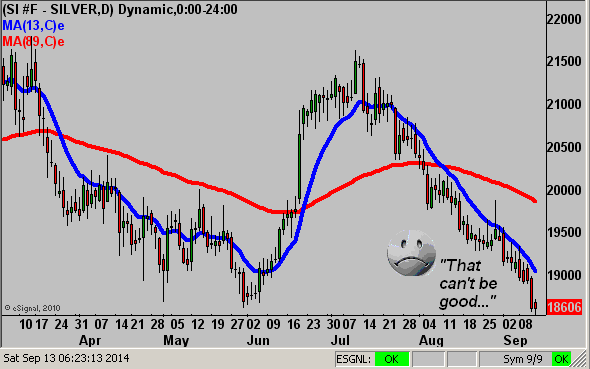
As promised, let's turn for a moment to Sister Silver. She's recorded a "lower-low" in eight of the last ten trading sessions. Indeed, the value of one Silver contract from the high of 10 July has lost $14,550 vs. a a single Gold contract being down $10,450, (39% less) for the same period. Again with reference to that written back on 16 August when Silver's price was 19.550 following the 13/89 EMA (exponential moving average) crossover, as freshly updated below: "...should price travel the "median" distance inherit of those prior crossings, price will sink into the 18s, and moreover should it travel the "average" distance of the crossings, 'twill reach down into the 17s..." Here at 18.606, the "median" distance of travel has been achieved, with the "average" for the 17s potentially in the balance:
But are the precious metals now technically oversold? For a near-term perspective, let's go to our Market Magnets from which we understand that price cannot get too far astray. (The Magnets are calculated from the "contract volume traded per price" data used to create the Market Profile charts). Here we've for the last three months a two-panel display of prices and magnets, (the thicker lines and boxed numbers in the upper portions -- the oscillators in the lower portions being price less magnet and their differences noted in the boxes). On the left for Gold, at better than 30 points below its magnet, the suggestion is that Gold is near-term oversold per the prior depths of the oscillator. On the right for Silver, its oscillator is not sufficiently deep enough to necessarily claim price is too low. Poor ole Sister Silver can't get a break!

Next let's pair up the Market Profiles themselves so as to determine their respective overhead near-term resistance levels. The horizontal bars represent contract volume traded per price point, the most commonly traded prices being the apices. The coloured swaths represent Friday's trading ranges and the white bar on each panel the closing price:

Pounded down into the base of the above profiles are both Gold and Sister Silver. But who needs 'em given the now soaring StateSide Economic Barometer...

...which along with "geo-jitters" is driving liquidity into the Dollar and spooking the S&P with the portent of an interest rate hike. Yet lest we forget, Gold has clearly risen during times of rate increases (2004-2006), it has risen in the face of so-called "Dollar strength" (2010), and at the end of the day, it has risen during periods of multi-national currency debasement, (post-Black Swan 2008), in that broadly it plays no currency favourites..
And in peeking to the west of San Francisco, we see that Japan's economy contracted -7.1% in Q2 ... how stimulating! To the east, France has slashed its growth forecasts and shan't meet the 3% EuroZone "required level" of GDP growth until 2017. On verra, but nevertheless ... how stimulating!
We'll wrap it up here for this week with a couple of "contrary" indicators.
1) Bloomy ran what had to be the headline, (albeit horribly worded), of the week with : "S&P 500 Beating World Most Since 1969 Doesn’t Spark Flows". At first I was not quite sure if they meant from the Index year of 1969 or rather from the Index price of 1969. Either way, how could the S&P be up so much were it not for sparked flows? Enter the contrarian and "Beating World Most" is now turning to toast.
2) The annual traveling so-nicknamed "Gold Show" shan't be passing through here as it has so done for many years 'round Thanksgiving, the organizers stating that: "The current challenged metals market has led us to make the difficult decision to suspend our events in the best interest of our participants, speakers, sponsors and stakeholders." Enter the contrarian who then wrote to us inferring that confirms the bottom is in!
So Bottoms Up! (And eyes up, as well, should the Black Swan be gliding by...)