Gold vs. the Euro Index can be a leader for gold in nominal terms. I was reminded of this when reading an aside within Tom McClellan’s article Copper Leads the Way Lower for Bond Yields, posted at Biiwii. His article was interesting to me because its thesis supports my view that long-term bond yields are due to decline. But the aside about gold and euros got me pulling some charts for this post.
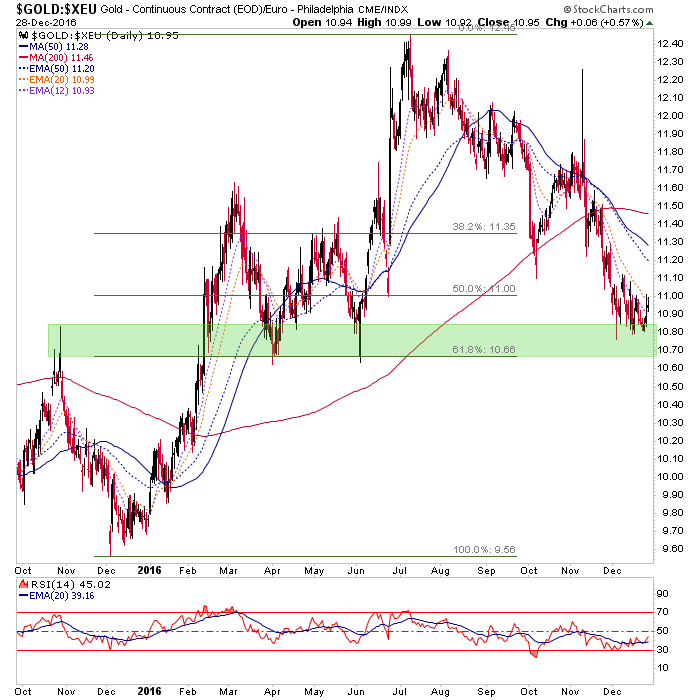
Au-XEU (daily) has declined to a support zone and retraced over 50% of the 2016 gain.

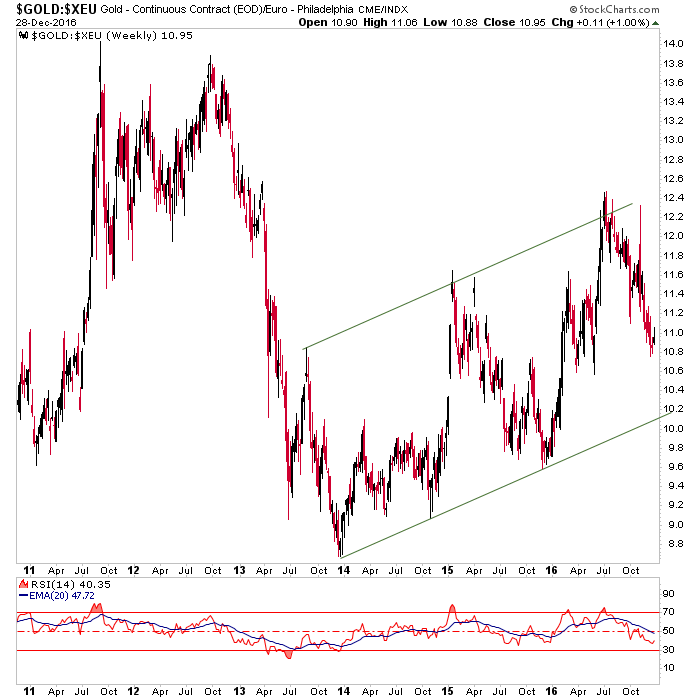
Au-XEU (weekly) is all well and good, in a ‘higher highs and higher lows’ uptrend over the last 3 years. But the concern is that the lower channel line is well lower than the current price. Au-XEU is under no obligation to decline that far, but markets (and especially the precious metals) often make the most dramatic moves imaginable before they reverse trend. The long-term trend is up but the intermediate trend is still down.

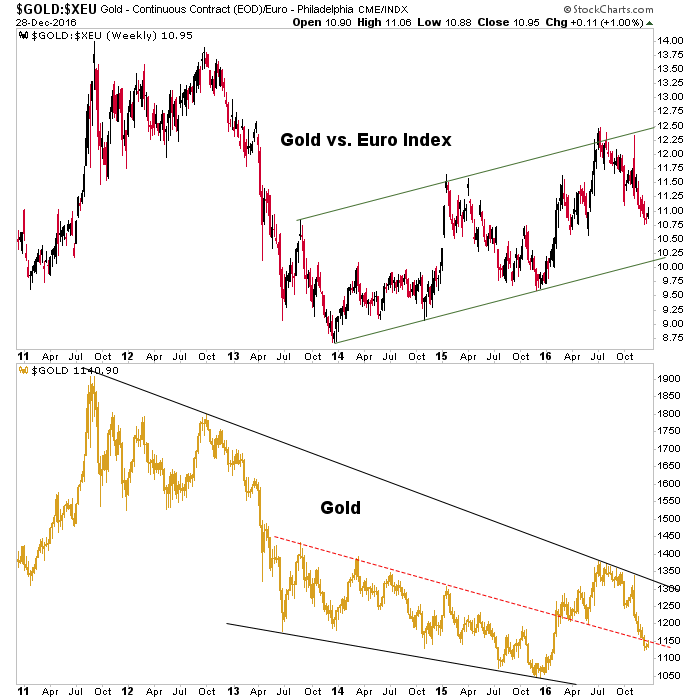
So there could well be more damage out ahead. This would finish sanitizing the gold sector’s sentiment (i.e. there would be no sentiment, just bleak hopelessness) before the 3 year positive divergence of Au-XEU to gold kicks in. Just maybe it will have forecast the final bottom in gold.

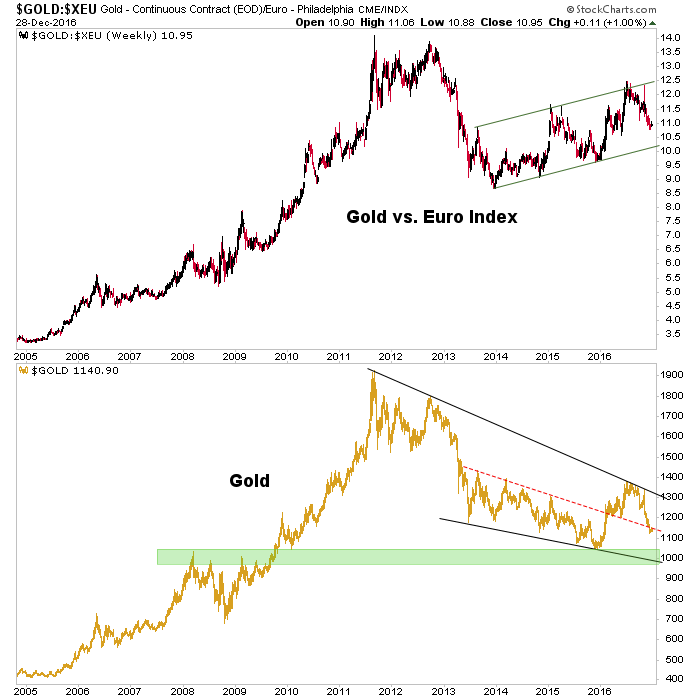
As a side note, yes, that is a much reviled (by me) bullish Falling Wedge I have drawn in gold. But here I ask you to consider that this is a very long-term structure (a massive bull flag, a half decade in the making) and also that it has come after a prior uptrend (indeed, a bull market), which is one of the qualifications for a bullish Falling Wedge to be considered in the realm of reality vs. someone’s dreamed up promotion.
What I find really interesting is that the Wedge bottom resides right near our old bear market target just below 1000 (actually, 960). The bullish Cup that formed in 2008-2009 was from a profound time period and just maybe gold still has some downside work to do in closing out the man-made bullish atmosphere that has been in play in one form or another since 2011. The brilliantly evil Operation Twist kicked off the festivities that continue to this day as global policy makers plug the dikes with ever more brazenness while Trumpmania holds sway in the US.

Maybe gold will go contrary bullish right now, but that is supported by neither technicals nor fundamentals at this time. Or perhaps 960 will, after all, be the marker for when policy makers finally throw in the towel of futility and the massive Trump-induced emotional event going on in the USA proves to be an epic, and contrarian, sentiment marker.
Gold will have a new bull market folks. If you’ve got patience and perspective, you’ll be just fine when it arrives. Au-XEU forecasts that it “is out there”, to quote Agent Mulder.
