
Gold Gains Limited By Stock Market Recovery
- An index of the dollar against a basket of six major currencies edged down about 0.2% on Tuesday. A weaker greenback makes dollar-denominated gold cheaper for holders of other currencies. However, gains were limited as Asian shares rose after a rebound in technology giant Apple (NASDAQ:AAPL) and stronger oil prices boosted Wall Street.
- Investors shrugged off yesterday’s comments from the Fed. Richmond Fed President Jeffrey Lacker (hawkish) said the US central bank should consider raising rates at its June meeting, beacuse inflation was moving toward 2% and labour markets had tightened.
- Assets of SPDR Gold Shares (NYSE:GLD), the world's top gold ETF, have been rising steadily this year and are at their highest since November 2013. US regulatory filings on Monday showed that some influential investors bought into gold through ETFs in the first quarter. George Soros bought 1.05 million shares in the SPDR gold fund, returning to bullion for the first time in three years.
- We maintain our bullish outlook on gold.
PRECIOUS METALS: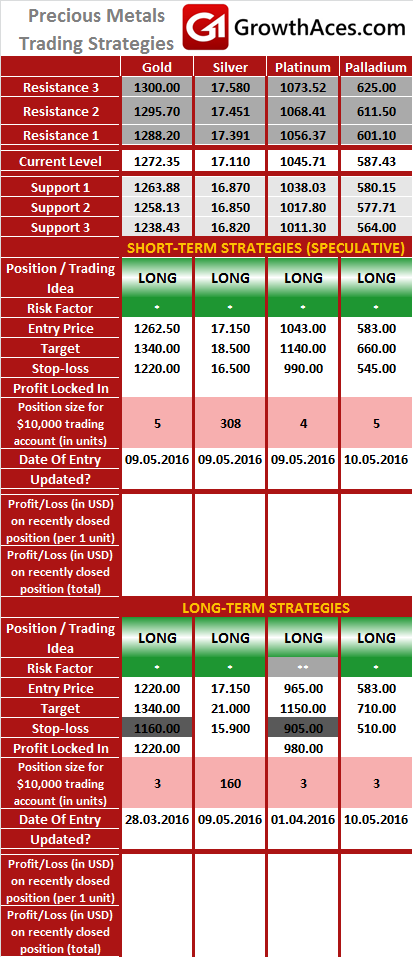
It is usually reasonable to divide your portfolio into two parts: the core investment part and the satellite speculative part. The core part is the one you would want to make profit with in the long term thanks to the long-term trend in price changes. Such an approach is a clear investment as you are bound to keep your position opened for a considerable amount of time in order to realize the profit. The speculative part is quite the contrary. You would open a speculative position with short-term gains in your mind and with the awareness that even though potentially more profitable than investments, speculation is also way more risky. In typical circumstances investments should account for 60-90% of your portfolio, the rest being speculative positions. This way, you may enjoy a possibly higher rate of return than in the case of putting all of your money into investment positions and at the same time you may not have to be afraid of severe losses in the short-term.
How to read these tables?
1. Support/Resistance - three closest important support/resistance levels
2. Position/Trading Idea:
BUY/SELL - It means we are looking to open LONG/SHORT position at the Entry Price. If the order is filled we will set the suggested Target and Stop-loss level.
LONG/SHORT - It means we have already taken this position at the Entry Price and expect the rate to go up/down to the Target level.
3. Stop-Loss/Profit Locked In - Sometimes we move the stop-loss level above (in case of LONG) or below (in case of SHORT) the Entry price. This means that we have locked in profit on this position.
4. Risk Factor - green "*" means high level of confidence (low level of uncertainty), grey "**" means medium level of confidence, red "***" means low level of confidence (high level of uncertainty)
5. Position Size (forex)- position size suggested for a USD 10,000 trading account in mini lots. You can calculate your position size as follows: (your account size in USD / USD 10,000) * (our position size). You should always round the result down. For example, if the result was 2.671, your position size should be 2 mini lots. This would be a great tool for your risk management!
Position size (precious metals) - position size suggested for a USD 10,000 trading account in units. You can calculate your position size as follows: (your account size in USD / USD 10,000) * (our position size).
6. Profit/Loss on recently closed position (forex) - is the amount of pips we have earned/lost on recently closed position. The amount in USD is calculated on the assumption of suggested position size for USD 10,000 trading account.
Profit/Loss on recently closed position (precious metals) - is profit/loss we have earned/lost per unit on recently closed position. The amount in USD is calculated on the assumption of suggested position size for USD 10,000 trading account.
Source: Growth Aces - Forex And Precious Metals Trading Signals