Save for Monday (30 November), we've 11 months of 2015 now in the books. And upon digging into our toolbox of "phamous phrases," there are two which come to mind in reflecting on the year-to-date: 1) "Change is an illusion, whereas Price is the truth," and 2) "The market is never wrong." With respect to the latter, it has priced gold at less than half what it "ought be" (based on currency debasement), and the S&P 500 at more than double what it "ought be" (based on earnings). 'Tis not the first time we've written of such observation, but the fact that the irrationality has endured throughout almost the entire year, save for a wee gold run here and a brief S&P sell spree there, the two markets remain at polar opposites. The sad bit of it all is that even at the highest levels of money management, its generational turnover has left behind the concept of value. "Greed" has dissolved its partnership with "Fear," such that when the latter finally does reappear, 'twill so do with a recoil nothing short of massive by both gold and the S&P simply reverting to their valuation means, (let alone the usual overshoot).
"But mmb, that kind of a change would hardly be an illusion!"
'Twill certainly be headline-making, of course, Squire, despite its merely being a return to normalcy. For all along, the invisible top story throughout has already been the delusion of illusion that has priced gold and the S&P at today's such unimaginable extremes, respectively of undervaluation and overvaluation, in the first place. To be sure, the trip back home is coming, as even Dorothy eventually returned to Kansas.
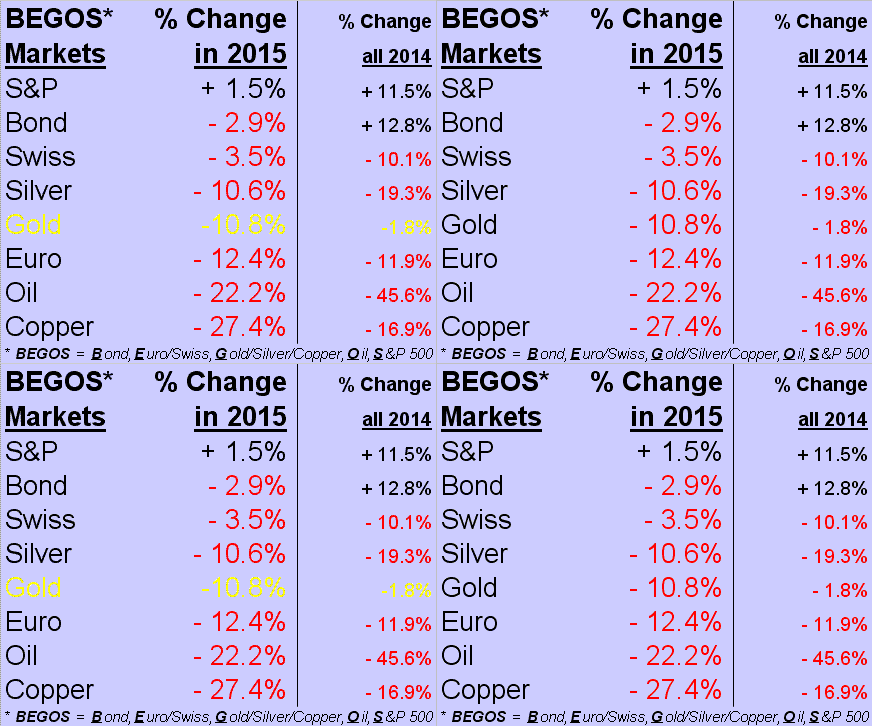
All that said, as 'tis essentially month's end, we go to our year-to-date standings of the BEGOS Markets with but December (and a day) still in the balance. And save naturally for the S&P, which can only go up despite the lack of earnings support, plus a dollar index +10.4% – even with M2 money supply sans Quantitative Easing +5.7% in 2015 – we're seein' nuthin' but red:
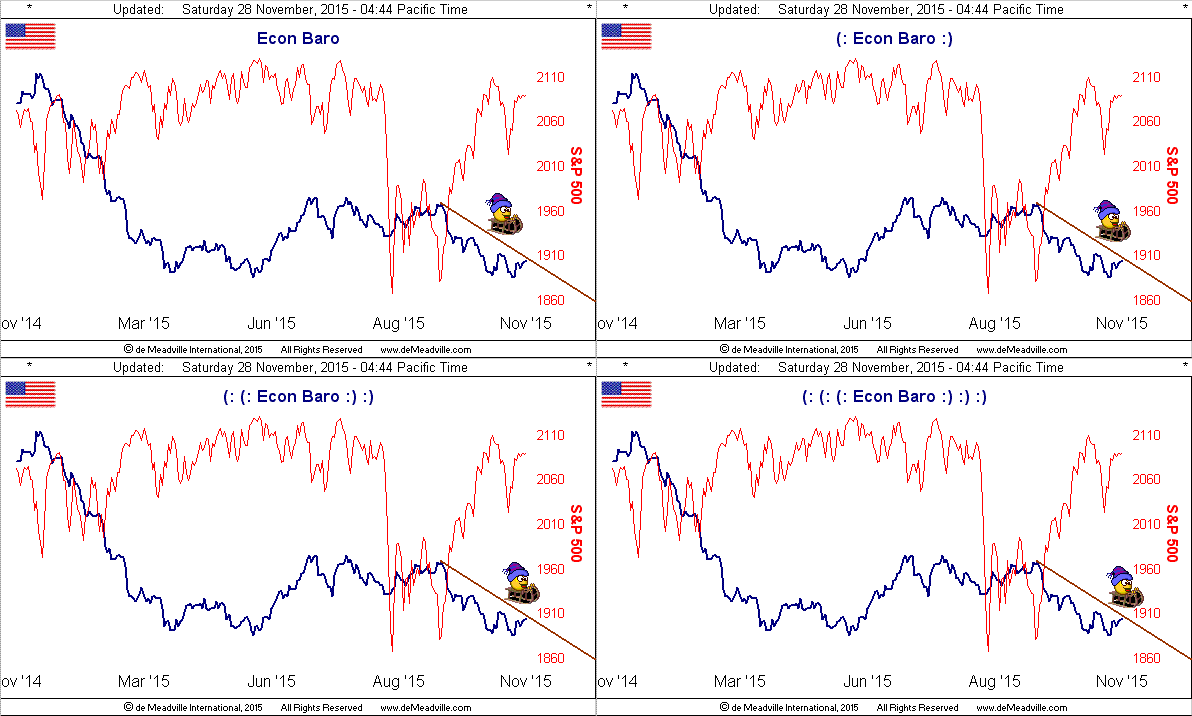
Indeed, were it all a soap opera, (which is a justifiable description at times, especially given the spreading perception of a Federal Reserve Bank rate hike in reality's face of languishing economic data), surely 'twould be entitled "As The World Shrinks." Our Economic Barometer continues to so do, sledding down the slippery slope even as the S&P wanders well off piste:
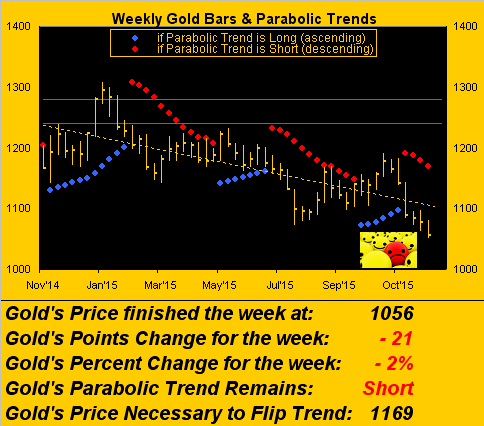
Meanwhile in the midst of such shrinkage we find gold, which today at 1056 has arguably discarded 89% of its M2 debasement mitigation, (if measured from the scoreboard's present valuation of 2566 back to the peak during 1980 of 873). 'Tis difficult to describe, that. For even given the Global Language Monitor's estimate of there being 1,025,109 words in the English language, quite frankly, we've all but run out of adjectives. Bittersweet as it may be, from the "A Picture Tells 1,000 Words Dept." here we've gold's bars and weekly parabolics, surrounded by the mirth of the mindless, price seemingly sinking toward 1,000 itself:
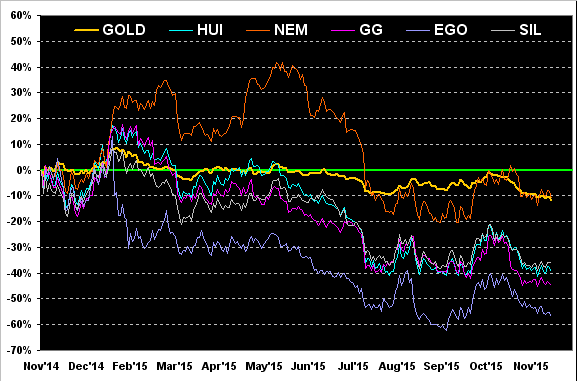
And but for a day, it being month's end, here next is our year-over-year view of gold's percentage track, the fellow trackers this time 'round being the Gold Bugs Index ("HUI"), Newmont Mining ("N:NEM"), Goldcorp ("N:GG"), El Dorado Gold ("N:EGO") and representing Sister Silver, the exchange-traded Silver Miners fund ("N:SIL"). Call it yuck for every invested buck:
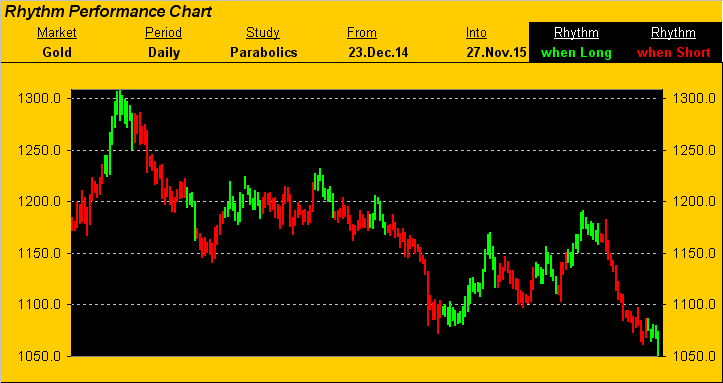
Specific to the metal itself, 'twas just one week ago that we'd taken at least a gram of encouragement from gold's daily parabolics having made the price bars turn from red (Short) to green (Long) now as below updated from last December-to-date. When gold resumes trading tomorrow (Sunday 15:00 Pacific Time), the next bar in the chart will be red:
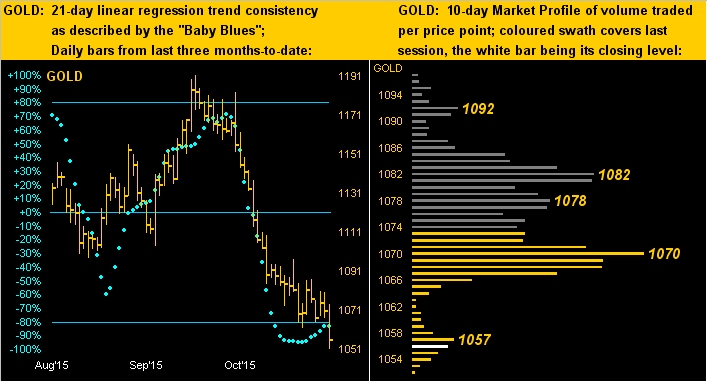
And as for yesterday, gold's "Friday Fizzle" even belied our beloved "Baby Blues" as below shown on the left, their curling up from the -80% level oft a reliable rallying cry as the consistency of the downtrend is calculated to be waning. Not so, so far. Further, in gold's Market Profile on the right, that's quite a block of near-term trading resistance spanning the 1070s:
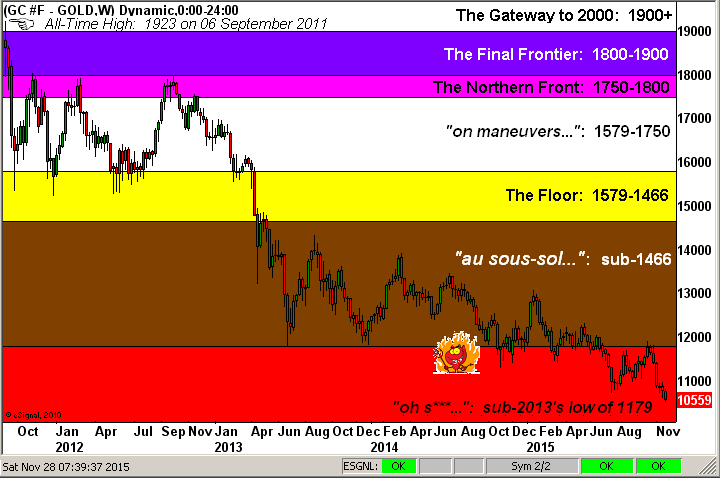
Again it being month's end, this missive wouldn't be complete without presentation of our structurally-defined chart of gold's weekly bars since the All-Time High of 1923 back on 06 September 2011. As if we haven't seen enough red already, right? Misérable!
'Course, with all around having cracked as we above saw in the BEGOS Market standings, save for the levitating S&P and determined Doggie Dollar, Fed "chairer" Old Yeller still insists the rate of rate raising will be slower than in previous hike cycles, (to which, given the sliding Econ Baro, we query: "Why raise at all?"). And again our own FedPres here, John "All Is Well" Williams just said a week ago: "Assuming that we continue to get good data on the economy ... a strong case ... can be made in December to raise rates", (to which, given this is San Francisco, we query "What is he smoking?"). Methinks at times 'tis the FedHeads that have cracked.
But then, "they" over at the Bureau of Economic Analysis were able to tweak Q3 gross domestic product growth to +2.1% for "show" – we say skeptically so – as it defies the direction the Econ Baro doth go. Moreover, notwithstanding with the convenience these days of online shopping, early reports on yesterday's foot traffic into stores made for a rather "Bleak Friday." This ought not be surprising as incoming Econ Data this past week pointed to lower existing home sales, with new home sales and personal spending falling short of estimates. But wait, there's more: two readings on consumer sentiment/confidence from the University of Michigan and the Conference Board both took tumbles, the latter scoring the second largest drop (from 99.1 to 90.4) since October 2013. 'Tis hard to spend dough when yer confidence is low.
Add to it all, per a FinTimes piece on data complied by S&P, of some 99 "global company" defaults year-to-date, (the most since the Black Swan's wake in 2009), 62 of them were by StateSide companies. How much more debt may get nixed upon a FedFunds nick? No worries: there's a fortnight to think it all over ahead of the Fed on 16 December.
No worries indeed, for amongst all this gloom, we've read some fairly fantastic news! According to ardent analysis from Bank of America (N:BAC), the S&P is seen reaching 3500 in just 10 years time. Given that earnings today need double, if not triple, to justify the current 2100 level, this "implies" companies having to improve their bottom lines fivefold by '25. Quite the challenge in a nation lucky to eke out 2% annual GDP growth to thus enable a 500% increase in earnings by then.
'Course seeing gold increasing to 3500 by '25 is perfectly logical, indeed perhaps conservative. In the interim, we'll maintain our focus on at least getting to gold 2000, such that price shan't be half what it "ought be" – but by then up there, might still be!
Come Wednesday we've the Fed's "Tan Tome," followed on Friday by, (per consensus), a flop for November payrolls. Fizzlin' times ahead, what?