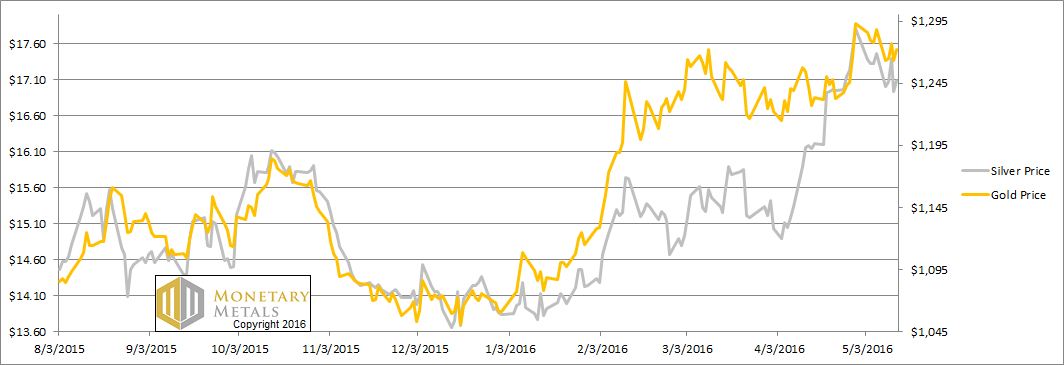
The price of gold moved down about sixteen bucks, while that of silver dropped about three dimes. In other words, the dollar gained 0.3 milligrams of gold and 0.04 grams of silver.
We continue to read stories of the “loss of confidence in central banks.” We may not know the last detail of what that will look like—when it occurs one day. However, we will wager an ounce of fine gold against a soggy dollar bill that it will not look like today with the market bidding dollars higher.
Loss of confidence is just a meme used by gold bettors. What are they using to make their bets? Dollars. What are they trying to win? More of the dollars they say will soon go bidless.
*Achem*
One benefit to looking at the supply and demand fundamentals is that it tells us, more accurately than price action, what confidence in the central banks is really doing. So let’s take a look at that picture. But first, here’s the graph of the metals’ prices.
The Prices of Gold and Silver
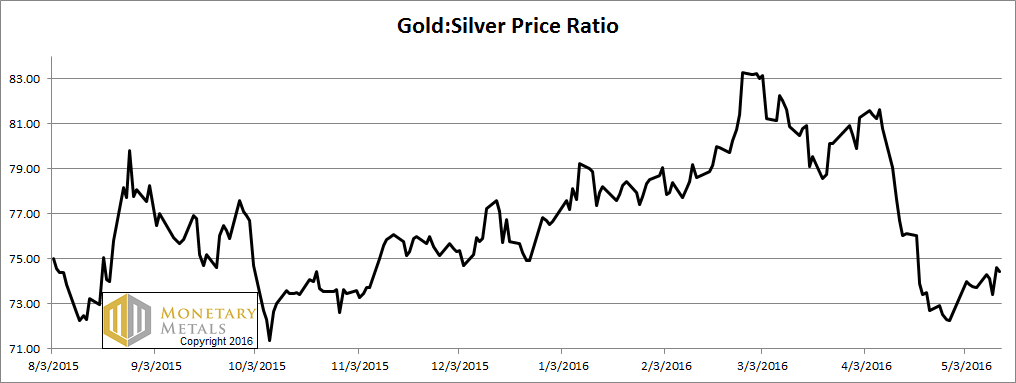
Next, this is a graph of the gold price measured in silver, otherwise known as the gold to silver ratio. The ratio was up this week.
The Ratio of the Gold Price to the Silver Price
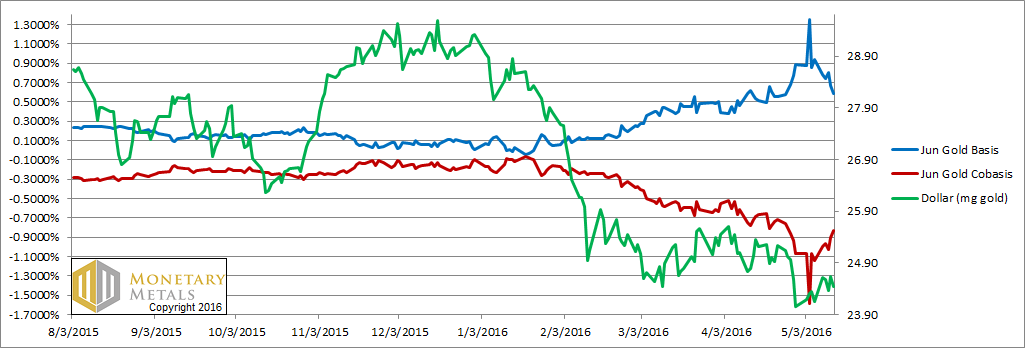
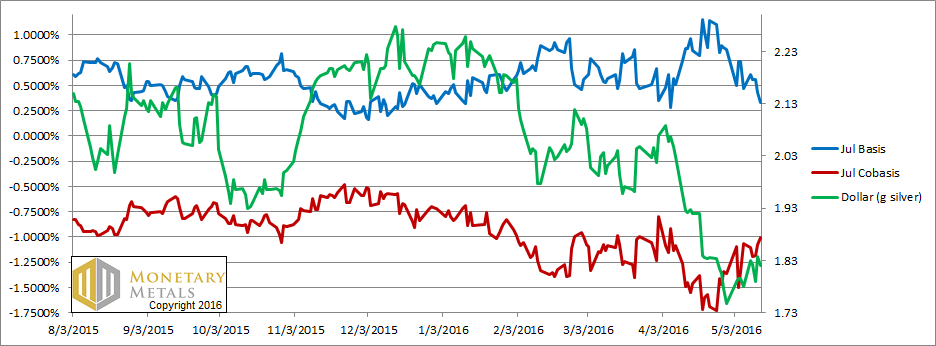
For each metal, we will look at a graph of the basis and cobasis overlaid with the price of the dollar in terms of the respective metal. It will make it easier to provide brief commentary. The dollar will be represented in green, the basis in blue and cobasis in red.
Here is the gold graph.
The Gold Basis and Cobasis and the Dollar Price
The price of the dollar is up (i.e. the price of gold, measured in dollars, is down) and the scarcity of gold (i.e. the cobasis, the red line) is up with it. This is our old pattern. When scarcity follows the dollar price, then it’s just speculators adjusting their positions.
Back to confidence in central banks. We can say two things. One, the fundamental price of gold is down (remember, this is the expiring June contract that is under heavy selling pressure, due to the contract roll, and hence will have a depressed basis and—in more “normal” post-2008 markets, a positive cobasis). It is down twenty bucks, about $40 below the current market price.
Two, confidence in central banks is still humming along just fine. The speculators are betting on gold futures to get more of those allegedly despised Federal Reserve Notes.
When the actual repudiation of central bank paper occurs, no one will want the stuff. Gold owners will no longer think of the value of their gold in dollar terms. Just as the people of Venezuela do not think of the value of their gold in terms of the collapsing bolivar.
Now let’s turn to silver.
The Silver Basis and Cobasis and the Dollar Price
In silver, it’s the same pattern as gold.
Our calculated fundamental price of silver dropped almost a buck. It’s now nearly two bucks below the market price.
In silver, even more than in gold, many speculators who do not question the validity of the dollar also do not question that silver is going up, and hence a great way to make some more dollars.
We now calculate a fundamental on the gold-silver ratio over 81.
