Get 40% Off
👀 👁 🧿 All eyes on Biogen, up +4,56% after posting earnings. Our AI picked it in March 2024.
Which stocks will surge next?
Unlock AI-picked Stocks

Gold, Gold Stock Correction Continues Despite Dovish Fed

Published 09/25/2016, 12:35 AM
Updated 07/09/2023, 06:31 AM

There were some hopes that a non-move by the Fed would end the current correction in precious metals and spark a move to new highs. Unfortunately, the Federal Reserve cannot override the supply and demand component of the market. Gold and gold stocks popped higher but less than two days later the sector (and specifically the miners) has given those gains back. That tells us plenty of sellers remain and this sector needs more time and perhaps lower prices before this correction ends.

The hourly charts, seen below, show the miners selling off after testing their 50-day moving averages. VanEck Vectors Gold Miners (NYSE:GDX) showed a bit more strength on this pop as it reached its 50-dma before retreating. VanEck Vectors Junior Gold Miners (NYSE:GDXJ) nearly touched $49, which is within 10% of the recent high before reversing those gains quickly. The miners could test recent lows before retesting their 50-day moving averages.
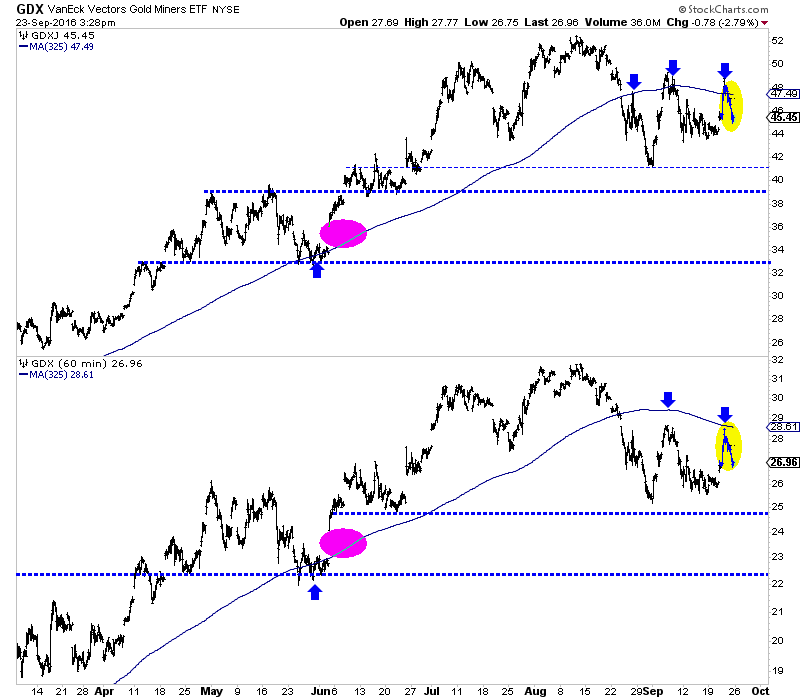
GDX Hourly Chart

The weekly charts indicate the correction can be deemed bearish consolidation. The candles from the past three weeks have not been remotely bullish. The miners had one solid down week followed by two weeks in which the market failed to hold its gains. GDX (top) has key support at $25 while GDXJ (bottom) is trying to hold above $44. Weekly closes below $26 and $44 could usher in more losses in the short-term.
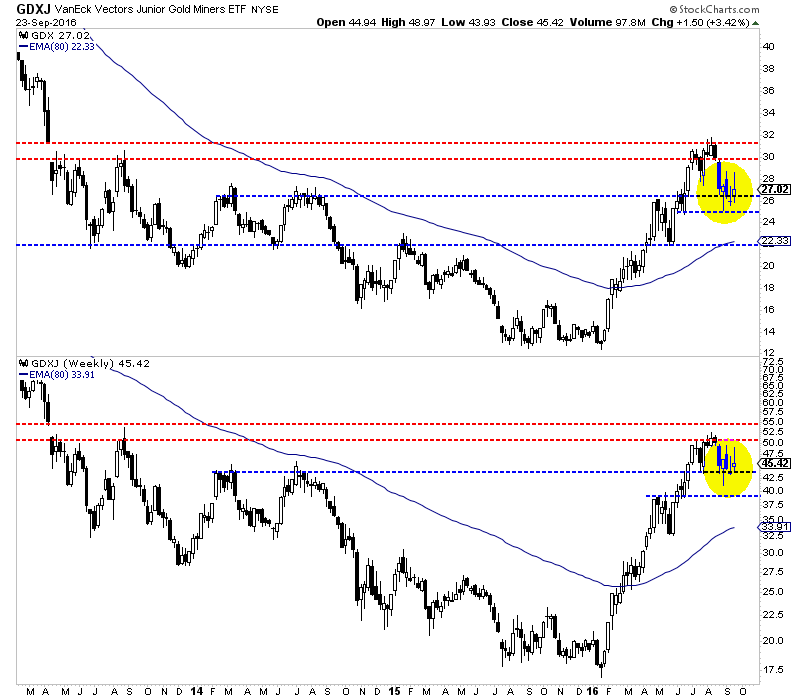
GDX:GDXJ Weekly 2013-2016

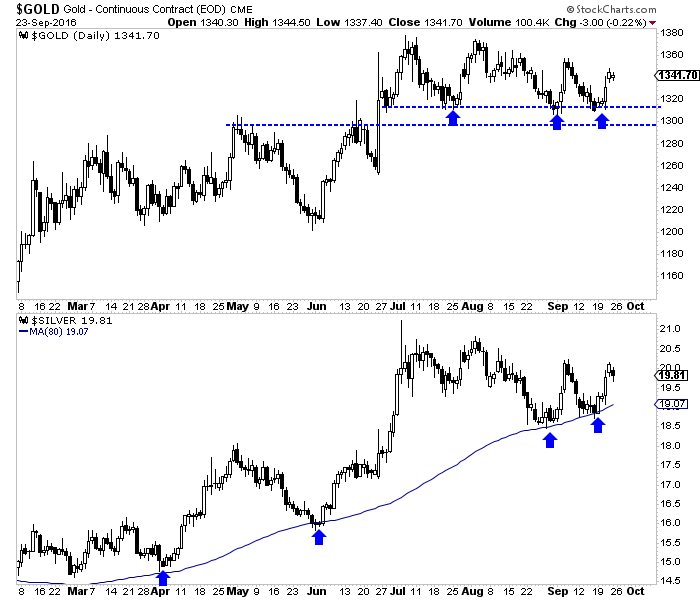
Turning to the metals, we find more encouraging signs as Gold and Silver have maintained support quite well. The daily candle charts for Gold and Silver can be seen below. For the third time in the past few months Gold was able to hold support at $1300-$1310. Meanwhile, Silver held its August low and has shown more strength than Gold recently. That is positive.
3rd party Ad. Not an offer or recommendation by Investing.com. See disclosure here or remove ads .

Gold and Silver Daily Charts

The precious metals sector remains in correction mode but the longer the sector can hold and digest recent gains without significant price deterioration, the more likely a bullish outcome becomes. The strength in the metals is a healthy sign but the relative weakness in the miners and failure to hold gains is a signal that the correction will definitely continue in terms of time.

Traders and investors should wait for either this market to become oversold or the correction to mature. In the meantime, focus on the opportunities scattered amongst individual companies rather than the sector itself.

Latest comments

OK, but it's already well known that the more often a support level is tested, the weaker it becomes. I say it's likely to break down for miners to a lower level. It's classic.
With Gold resting on 1341, it looks like Gold is rallying again? Sell out your stocks and you could easily find yourself left by the wayside unable to find an entry point as prices chase higher? Of course in this crazy world anything could happen? With so many Fiat currencies and banks heading for a crunch. Think I'll stay long and ride through Gold's light shower and then catch the Hurricane that is coming and will lift Gold and precious metals to crazy levels. Its coming! Its not if, its when!
Risk Disclosure: Trading in financial instruments and/or cryptocurrencies involves high risks including the risk of losing some, or all, of your investment amount, and may not be suitable for all investors. Prices of cryptocurrencies are extremely volatile and may be affected by external factors such as financial, regulatory or political events. Trading on margin increases the financial risks.
Before deciding to trade in financial instrument or cryptocurrencies you should be fully informed of the risks and costs associated with trading the financial markets, carefully consider your investment objectives, level of experience, and risk appetite, and seek professional advice where needed.
Fusion Media would like to remind you that the data contained in this website is not necessarily real-time nor accurate. The data and prices on the website are not necessarily provided by any market or exchange, but may be provided by market makers, and so prices may not be accurate and may differ from the actual price at any given market, meaning prices are indicative and not appropriate for trading purposes. Fusion Media and any provider of the data contained in this website will not accept liability for any loss or damage as a result of your trading, or your reliance on the information contained within this website.
It is prohibited to use, store, reproduce, display, modify, transmit or distribute the data contained in this website without the explicit prior written permission of Fusion Media and/or the data provider. All intellectual property rights are reserved by the providers and/or the exchange providing the data contained in this website.
Fusion Media may be compensated by the advertisers that appear on the website, based on your interaction with the advertisements or advertisers.
© 2007-2024 - Fusion Media Limited. All Rights Reserved.