Gold and Crude Oil have retreated further during the Asian session as traders likely unwind fear-driven positioning that had been built on concerns over escalating tensions in the Middle East. The precious metals may yet find some relief on the back of a weaker greenback in the lead-up to the June FOMC rate decision.
Iraq Tensions Fail To Spur Further Crude Gains
The latest developments in the rapidly unfolding crisis in Northern Iraq have proved insufficient to keep the crude oil bulls invigorated. Reports from newswires suggest that the US will deploy as many as 275 troops in response to a series of escalating conflicts between insurgent forces and the Iraqi army.
Iraq as OPEC’s second-largest member accounts for more than 11 percent of the group’s supply of crude oil. Thus if militant forces were to gain control of key production facilities or oil fields, there could be severe ramifications on regional supplies.
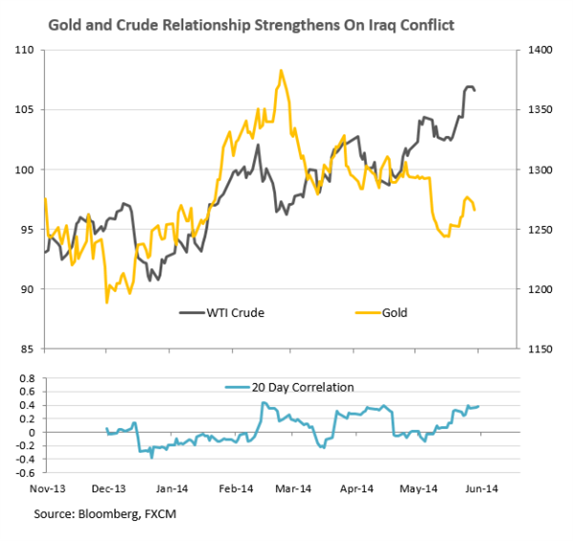
However, at this stage the country’s crude oil production which is centered in the south appears to have been unaffected by the attacks. This suggests the presently elevated levels for WTI and Brent are predicated on speculation alone, which may leave the benchmarks vulnerable to a correction on a swift resolution to the saga. Similarly, gold and silver which were likely bid higher on fears of a further escalation could drop as safe-haven demand for the precious metals fades. Indeed, the 20 day correlation between gold and crude oil reveals a strengthening relationship between the two commodities since the crisis began (see chart below).
Gold Looks To Fed and Inflation Data
The June FOMC rate decision headlines the economic calendar in terms of event risk for the precious metals over the remainder of the week. With the central bank widely expected to continue winding back its stimulus program, attention will be centered on the statement and ensuing press conference for hints at the potential path for rates. Patchy US economic data over recent months may see Fed officials retain a dovish tone which could leave the US Dollar to flounder and afford gold some breathing room.
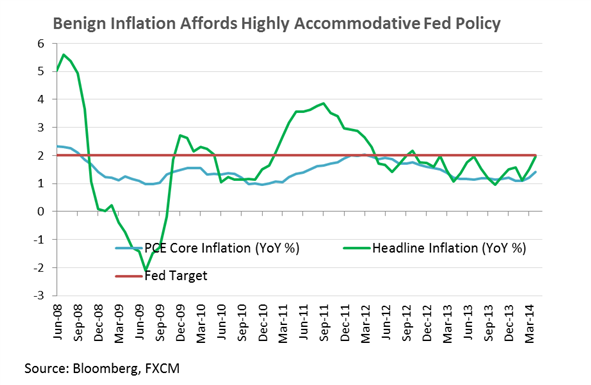
Persistently low inflation in the world’s largest economy has allowed policy makers to maintain a highly accommodative stance. Even if upcoming CPI figures offer a slight upside surprise, the impact on the greenback may be limited, given the Fed’s preferred measure of inflation (Core PCE) continues to track well below their 2 percent target (see chart below). It would likely take a material lift in the general price level for Committee members to express concern and for policy expectations to shift.
Crude Oil: Upside Breakout Affords Bullish Technical Bias
WTI has broken above the triangle formation on the daily and cleared the psychologically-significant 105.00 handle. The upside break coupled with the re-instatement of an uptrend for the commodity affords a bullish technical bias for crude oil. However, with resistance looming nearby at 108.40 long entries may be better served on pullback to the original breakout point.

Gold: Bulls Retreat After Failing To Close Above Resistance
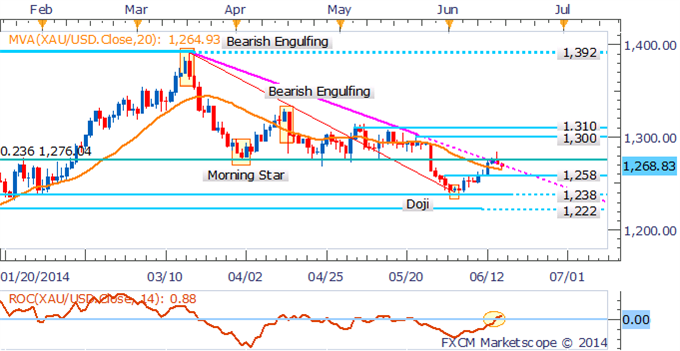
Gold has failed to close above noteworthy resistance at 1,276 (23.6% Fib Level), suggesting a lack of conviction amongst the bulls. The pullback conflicts with bullish signals offered by a push by the 20 SMA and Rate of Change indicator, which suggest that an uptrend has emerged. Taken together this leaves a mixed technical bias for gold. Further falls are likely to be met by support at 1,258.
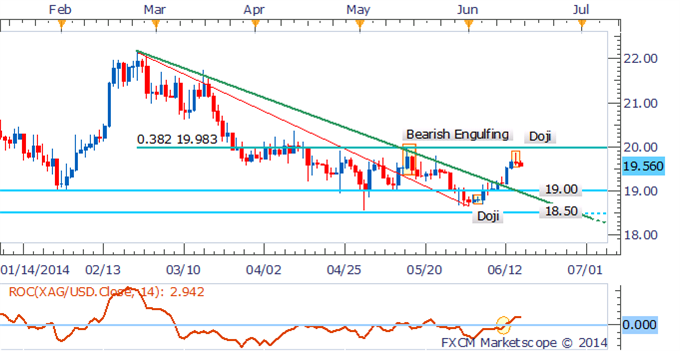
Silver: Bulls Retreat As Doji Signals Hesitation
Silver traders are showing signs of hesitation as denoted by the Doji formation on the daily near the critical $20.00 handle. While the Rate of Change indicator continues to reflect upside momentum, a recovery may prove limited given resistance looms nearby.
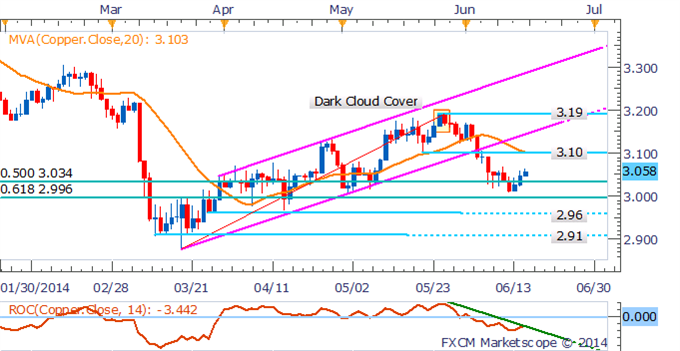
Copper: Recovery To Offer New Short Entries
Copper continues to recover ground, however, at this stage the downtrend remains intact, as signaled by the 20 SMA and Rate of Change indicator. This suggests a bounce back to resistance at $3.10 could afford new short entries.
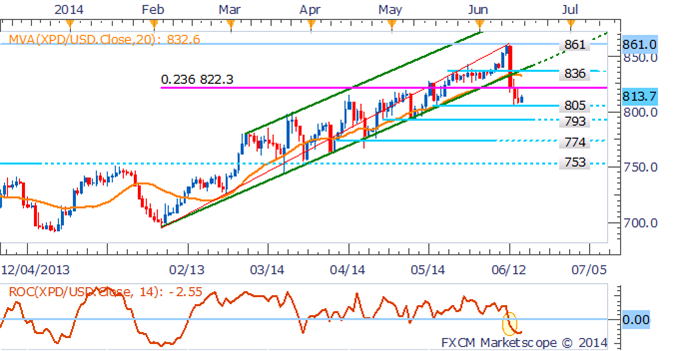
Palladium: End of Uptrend Suggests Further Weakness Ahead
Palladium’s recent plunge has ended the commodity’s uptrend that had persisted since early February. The break below the ascending trend channel and support at 836 suggests the potential for further weakness. A daily close below support at 805 would open the 793 mark.
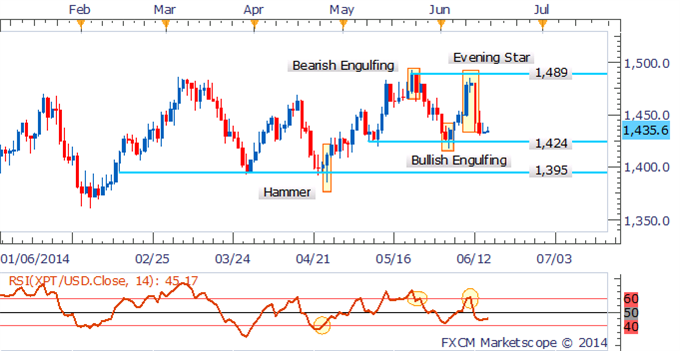
Platinum: Awaiting Bullish Signal Near Range-Bottom
Platinum has found some buying support shy of the range-bottom at 1,424. A bullish candlestick pattern would help confirm a reversal, which would suggest a run back towards the 2014 high near 1,489.
