Get 40% Off
🚨 Volatile Markets? Find Hidden Gems for Serious Outperformance
Find Stocks Now

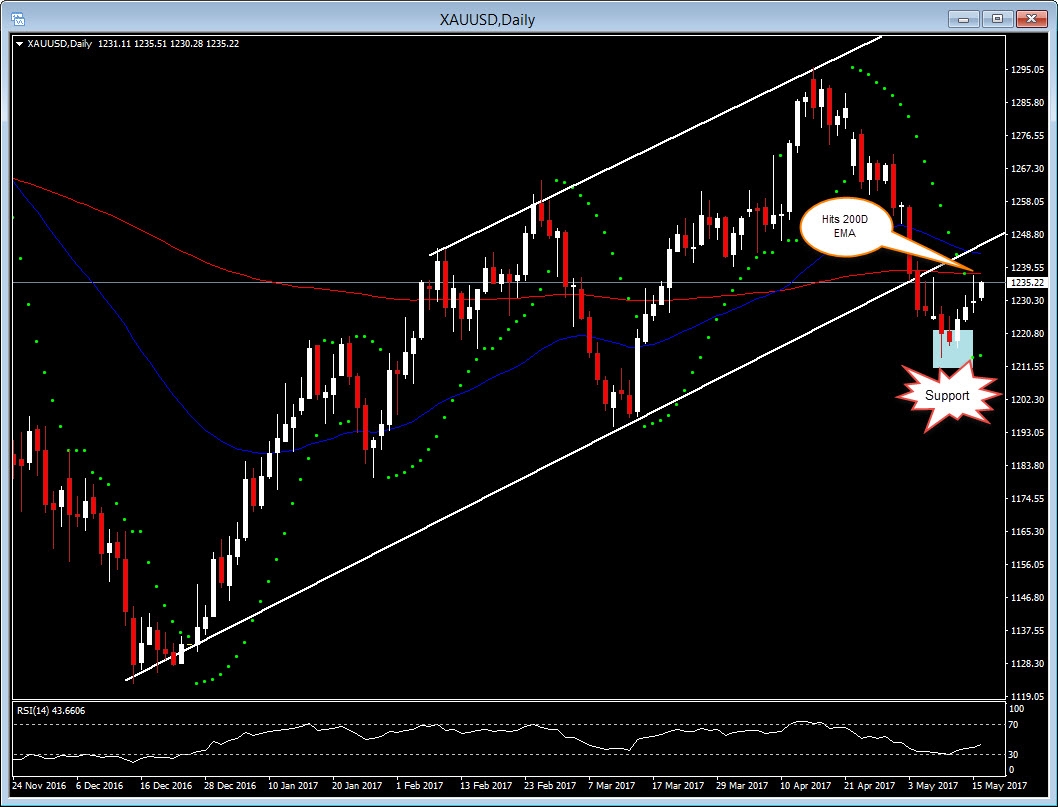
Gold Action: Breached 200-day EMA

Published 05/16/2017, 04:02 AM
Updated 03/12/2019, 11:25 AM

XAU/USD, Daily
On Friday I wrote:

In general, XAU/USD seemed more stable this week since it holds above $1,214.00, which is also a confluence of 38.2 Fibonacci Level, since Tuesday. Technically, XAU/USD in the 4-hour and Daily chart as well, satisfies quite well a year’s uptrend Channel, while many indicators seem positive on a possible reversal of the down trend since April 17.

In the Daily chart, MACD remains positive, while RSI is 39 pointing up. Therefore, I believe that a break above $1,236.00 – $1,245.00 area, which actually is the area between the significant 200 Day EMA and 50 Day EMA (also 50.0 Fibonacci), will suggest a bullish momentum for XAUUSD. In this case, it is possible to see XAU/USD getting back in Channel and to reach higher prices.

Indeed yesterday, gold breached and broke the significant 200-Day EMA, since it manages to rally yesterday to $1,237.13, a one-week high. North Korea’s missile test over the weekend provided support, while the weaker Empire State index, and subsequent dollar weakness have lifted the contract more recently.

Currently, XAU/USD is at $1,234.54, after yesterday’s close at $1,230.00. Hence Friday’s analysis on gold seems that is ready to be fully satisfied by the performance of the commodity, and by the additional positive momentum that indicators are pointing out. RSI is at 43 sloping up, long-term MACD (30,50,9) remains positive, while Parabolic SAR turned positive just yesterday.

We are anticipating a much further bullish momentum in the upcoming weeks for XAU/USD, especially once, it breaks the area we suggested on Friday. Nevertheless, if today’s US data (U.S. Housing Starts, Industrial Production and Capacity Utilization), fall short of expectations, then this might weigh more on the US dollar.

3rd party Ad. Not an offer or recommendation by Investing.com. See disclosure here or remove ads .

XAU/USD Daily Chart

Latest comments

Risk Disclosure: Trading in financial instruments and/or cryptocurrencies involves high risks including the risk of losing some, or all, of your investment amount, and may not be suitable for all investors. Prices of cryptocurrencies are extremely volatile and may be affected by external factors such as financial, regulatory or political events. Trading on margin increases the financial risks.
Before deciding to trade in financial instrument or cryptocurrencies you should be fully informed of the risks and costs associated with trading the financial markets, carefully consider your investment objectives, level of experience, and risk appetite, and seek professional advice where needed.
Fusion Media would like to remind you that the data contained in this website is not necessarily real-time nor accurate. The data and prices on the website are not necessarily provided by any market or exchange, but may be provided by market makers, and so prices may not be accurate and may differ from the actual price at any given market, meaning prices are indicative and not appropriate for trading purposes. Fusion Media and any provider of the data contained in this website will not accept liability for any loss or damage as a result of your trading, or your reliance on the information contained within this website.
It is prohibited to use, store, reproduce, display, modify, transmit or distribute the data contained in this website without the explicit prior written permission of Fusion Media and/or the data provider. All intellectual property rights are reserved by the providers and/or the exchange providing the data contained in this website.
Fusion Media may be compensated by the advertisers that appear on the website, based on your interaction with the advertisements or advertisers.
© 2007-2024 - Fusion Media Limited. All Rights Reserved.