As we glide through these (one might say "hardly") "...lazy hazy crazy days of summer..."--(Nat King Cole, 1963), indeed now just a week ahead of those dog days of August, ours is titled as a dual-subject missive this time 'round. As regards {{8830|Gold's}} summer support, you can relax: 'tis time to sit back in the shade and enjoy that cool lemonade. As regards looking at leverage: in what flavour of gold do you imbibe?
Let's start with support. Barring your having been inattentively off the planet in recent weeks, we expect you're acutely aware that gold's rocket rise thus far in 2016 stopped precisely at our revised high target for the year of Base Camp 1377. ('Twould be lovely if we're proved wrong, thus giving us the opportunity to cite something still further up the road in the 1430s).
That said, as we've expressively detailed in recent missives, gold is by historical standards having an outlying percentage growth year, presently +24.7%, (and when 'twas topping at Base Camp 1377 on 06 July, +29.8%). Again to that end, gold in the last 40 years has netted annual gains exceeding 30% but three times, (in 2007, 1979 and 1978).
Now having settled out the week yesterday (Friday) at 1322, to say that price has "suffered a setback" from Base Camp 1377 is a bit of an overstatement, especially considering the very visible support just below here. In other words, we see further gold downside from here as very limited.
To be sure, both gold and silver are losing the consistency they'd had in their 21-day linear regression uptrends as evidenced by their declining "Baby Blues" that we below see in the daily bars from three months ago-to-date for gold on the left and silver on the right:
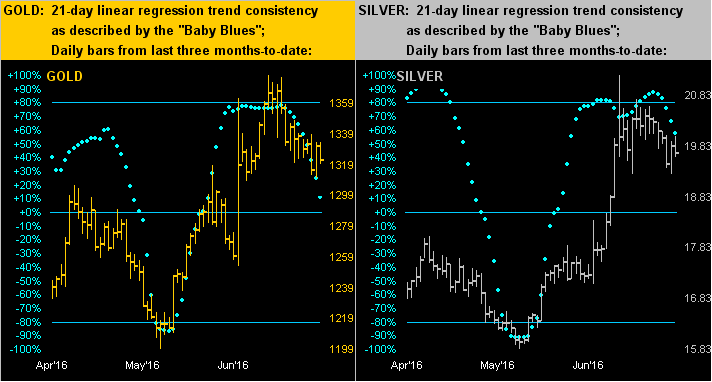
So how low might gold go? A week ago we were looking for near-term price to go "to and fro", which is clearly what we've since had, don't you know. And although the "Baby Blues" are falling at an accelerating rate, (such that upon crossing below their 0% horizontal axis in the new week, they'll reflect the 21-day trend as down), there's not a lotta room for a lotta down. In reference to gold's above panel, see all of that pricing "bunching" both at the left and center?
Gold's low trade for the week (1311) already recoiled back up from that center bit. However, with the trend turning south, we can take supportive comfort in that which we otherwise hate: The Whiny 1290s. Hardly do you need be reminded of price having gotten stuck in and around there for some 16 months during 2013-2014. Once massive resistance, The Whiny 1290s ought now work as massive support. I know, I know: that'd be another 30 points lower from the present 1322 level.
But 30 points is peanuts given (per our opening scoreboard) the 1,280 upside points awaiting us in the wings just to compensate for StateSide currency debasement alone. (And yes, that's the first time the scoreboard's valuation for gold has crossed above $2,600/oz. Taah-Daah!)
Moreover, should gold go beyond the edge of adhesion as provided by The Whiny 1290s, there's the thick 1280-1240 support zone sitting there to save the day, as we below see per gold's weekly bars. Again, the wee green arrow is a structural supporter there at 1306:
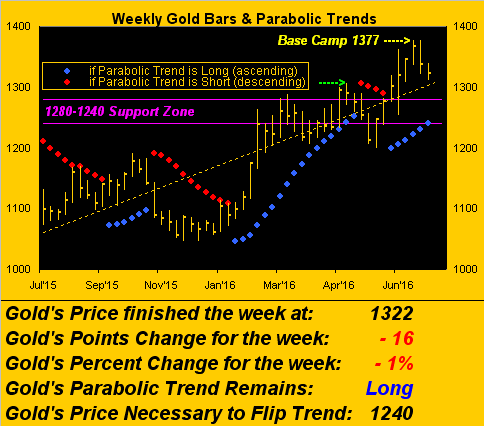
Does this mean gold shall spend the balance of 2016 sandwiched between The Whiny 1290s and Base Camp 1377? From a viable technical perspective, yes. From an election/Brexit/irrelevant Fedxit/wheels-coming-off-the-civilized-world fundamental perspective, no.
Either way, as we next peek at the 21-day (one month) percentage tracks of gold vs. the S&P 500, betwixt the two, one might be wary of the squish...
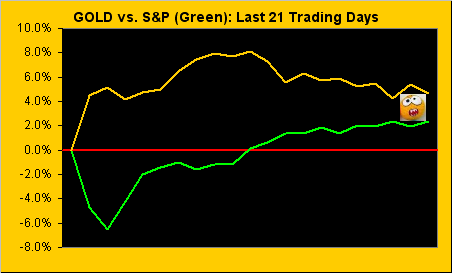
...cute perhaps. 'Course in reality, 'tis not gold about which we're wary a wit, rather 'tis, (as was so diligently dissected in last week's missive), the S&P, presently at record level of 2175. As a maverick market analyst put it on radio yesterday, the stock market is being financially engineered to ensure a correction shan't take place prior to Mrs. Clinton's being elected President.
The PPPT ("Political Plunge Protection Team")? Perhaps, but 'tis our preference not to go there, for apolitically, today's S&P simply is supported neither by earnings nor monetary inflow. But 'twill be once again in due course. Got gold?
"Still like I said, mmb, yer Econ Baro keeps gettin' better, huh?"
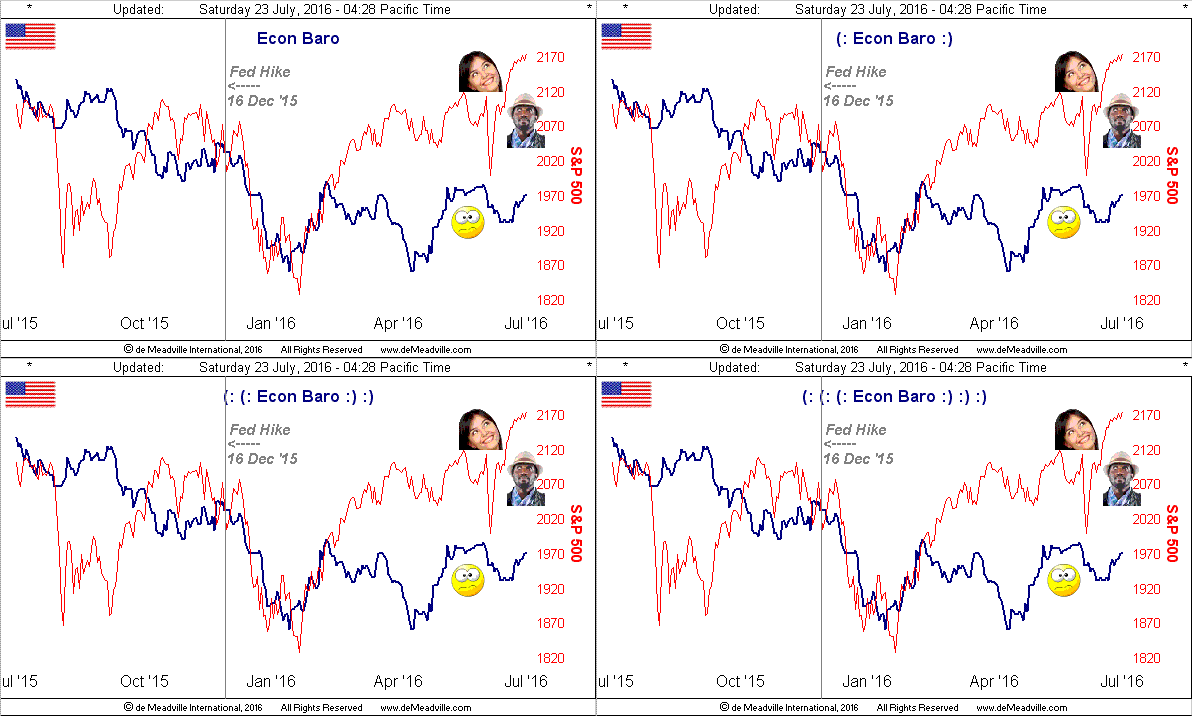
Well Squire, one might say that "better is in the eye of the beholder". As surmised last week, the lagging summarized report from the Conference Board of June's Leading Indicators did swing from May's -0.2% to +0.3%, the Economic Barometer having already built in that expectation.
Indeed, the FinMedia was all smiles over improved sales of existing homes as well as over increases in both housing starts and building permits, (albeit the prior period results for the latter two were revised lower). Neither getting much notice were the reduction in the National Association of Home Builders' Index, nor the swing from positive to negative for the (as we phondly refer to it) Philly Phed Index. But net-net, up the Baro crept:
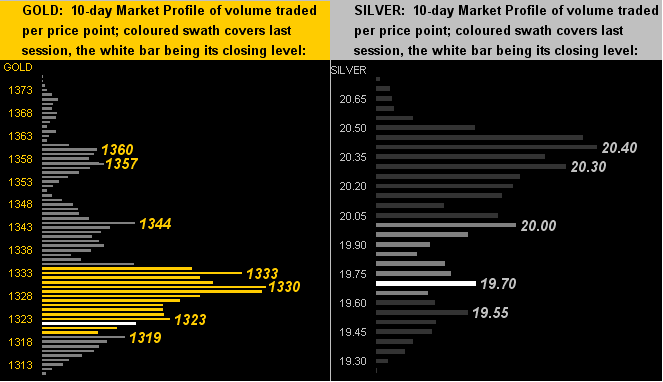
What indeed crept, or some may say leapt, down through their 10-Day Market Profiles were the Precious Metals, the white respective bars being the present below levels for gold (left) and silver (right). From two Gold Updates ago, as noted last time also: "...we'd like to see 1322 hold for gold, and 19.30 stay solid for silver."
Both those levels bust this past week, gold as you know going as low as 1311, though Sister Silver just mildly so, her tapping 19.27 before rebounding to her below shown 19.70 level:
Again the good news is, at least from our purview, gold's downside is very limited, whilst the upside is most liberative. So with respect to the aforequeried quip "Got gold?", as promised...
Let's look at leverage.
Gold is the "Sara Lee" of all things traded, adorned and owned. Oh to be sure, there are those who impune it, claim to short it (to the extent they're around anymore), or classify it as a curio: but at the end of the day, nobody doesn't like it.
And yet, we all have our favoured flavours of gold. At our Sunday Investors Roundtable, there are those who pound the table for the coins, those who instead swear by gold's equities, and those who are eccentrically erratic enough to engage in the gold futures.
I was asked last month on The Real Money Show about the virtue of owning physical gold, a question which may be the most rhetorical on record. The simple one-syllable answer is "DUH!", (not that such was our response, but 5,000 years of gold reverence goes a long way to making the case). Fast-forward to modern times and a gold coin in your pocket shan't vanish in a digital heartbeat.
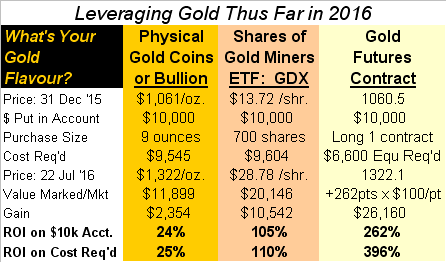
Anyway, whatever the vehicle used to float your Golden boat, we put together the following table of year-to-date returns for physical gold, for the exchange-traded miners fund VanEck Vectors Gold Miners (NYSE:GDX), and for the gold futures, respectively represented in three columns.
We begin with the settle prices at 2015's year-end for the three choices, with the assumption that you invested $10,000 in one of them. And in rounding off the purchase sizes, you'd either have bought 9 ounces of physical gold, or 700 shares of GDX, or gone Long one gold futures contract. (For the latter, the equity requirement per contract is only $6,600, but 'twould be wise to have some "cushion" in your account, and thus we go with $10,000 there as well).
You can then see the settle prices as of yesterday (22 July), the marked-to-market value of the three investments, and their monetary gains. Then come the bottom two emboldened rows: your gold coins account is up 24% in value, but your GDX account is up 105%.
Or instead, if you're a WAFT ("wild-ass futures trader"), how does a 262% account increase grab ya? (Moreover, were you have come to the table with only the minimum futures equity requirement of just $6,600 -- never having been under water as Gold did mildly gap higher to start the year -- that gain of $26,160 is a 396% return!)
Now before all y'all break from your lemonade shade and go runnin' out there to open that futures trading account, there's a reason why the disclaimers in that speculative area are more lengthy than the Federal Tax Code: your coins will always be worth something, and CDX shares shan't go below zero ... but you can lose a heckova lot more dough than is stocked in your futures account, (which for you WestPalmBeachers down there means you can lose more than your investment). Here's the table:
And dear readers, I know there are those of your who indeed take the leveraging one step further by doing options on the futures toward realizing gains of 1,000% and beyond. No need to write in; I'm just humbled that you're out there.
In closing, as we saw last time, the Big Banks continue to report weaker Q2 earnings than recorded a year ago, notably Bank of America (NYSE:BAC) coming in with 36¢/share vs. its prior 45¢/share, and Morgan Stanley (NYSE:MS) with 75¢/share vs. its prior 79¢/share. "But they both beat estimates!" Rubbish. We're only just early on in Q2 Earnings Season, and you can mind its daily tallying at the website.
Pressing on into the new week, we ought see volatility begin to again ramp up; if you've been following our "expected daily trading ranges" (EDTRs) at the website, you'll note their having narrowed across the board.
But come Wednesday (27 July) we get the Federal Open Market Committee's next statement on interest rate policy, (no rate change there, but the text, sans a Chair Yellen press conference, shall be sensationally scrutinized), and then come Friday (29 July) is our first peek at Q2 annualized gross domestic product.
Might it hit the +2.6% consensus? By the track of the Econ Baro these last three months, we'd say no. But yes, I know: 'tis an election year. Just hang onto your Gold!