Obviously pigs can fly. One need only glance up at the S&P 500's essentially correction-less track over the past six years to seem 'em soarin' high on pure porker power. As if a jumbo jet that can endlessly fly without requisite fuel, the pigs have provenly so done without requisite earnings, made evident by the Index having tripled since its March 2009 low with the price/earnings ratio more than doubling since then, (Bob Shiller's "CAPE" version going from 13.3x to 27.5x and our "live" version more than tripling from 11.6x to 35.4x).
But then I forget that in the new market paradigm of recent years, earnings growth is no longer requisite for pigs to fly high. Here's a quintessential example of why: a FinMedia radio report credited yesterday's (Friday's) stock market rise with not just the temporary EuroDebt reprieve for Greece, (one of the so-called PIIGS), but moreover that a certain high profile company's reporting of weaker quarterly earnings nonetheless beat estimates. That is the key, see? And in turn, Gold is the "screwee". Oh mercy me!
And lest we forget, there's the Economic Barometer, (or at least what's left of it). From its recent peak 46 trading days ago on 15 December, (the S&P then being at 1990), the Econ Baro's cascade down through yesterday is the largest plunge over the same number of days since those ending 21 June 2012, during which time the S&P dropped better than 107 points -- and following which on 13 September 2012 came the announcement of Quantitative Easing III. But this time 'round with an identical Econ Baro 46-day plunge, the S&P has instead risen 120 points! And prior to 2012, there's been just one other period, since compiling the Econ Baro data all the way back from 1998, that we've seen such a same magnitude, 46-day plunge...
"During the 2008 credit crisis, mmb?"
Exactly right, Squire, when rather than pigs flying high, 'twas instead The Black Swan. Fairly scary, what?
So maybe, just maybe, the Econ Baro as we see below going "bye-bye" is swinging that which is the pendulum of the Federal Reserve Bank's Federal Open Market Committee from considering a rate rise to instead providing the next round of QE. (They just don't realize it yet, for they are a "behind-the-curve" bunch). But based on the FOMC's Minutes released this past Wednesday of the 27-28 January meeting, the members may well have taken a peek at the traditionally market-leading Econ Baro, which since such meeting has dropped into ever-faster free fall.
"To raise, or not to raise, that is the question! Perchance to QE?"
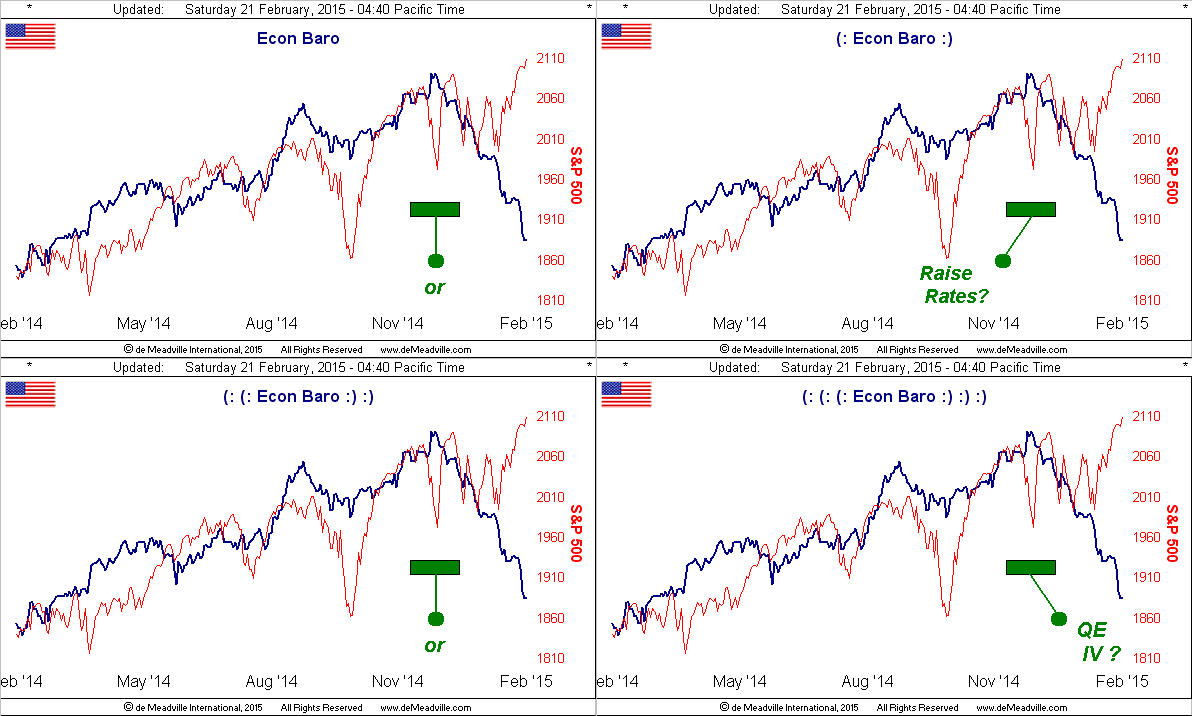
And the double entendre of using the roman numeral "IV" for the next QE is nothing short of perfect, should it continue that the economy find itself in hospital on an IV. For the present however, if anything needs an IV right now 'tis Gold, its having been forced to give up the parabolic Long trend as we see below in the year-over-year weekly bars graphic, the rightmost red dot putting the Short trend into play:
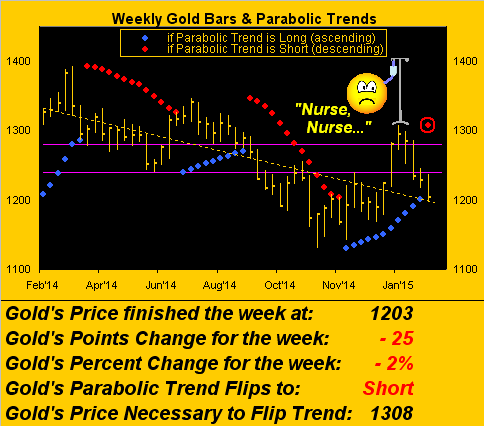
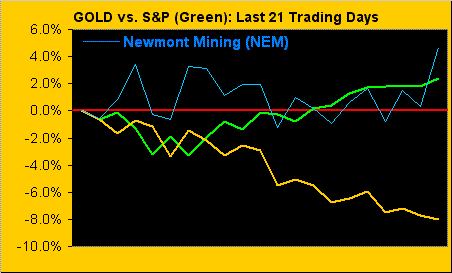
Indeed 'twas just four weeks ago that we'd gotten all wound up about Gold's having cleared the 1240-1280 resistance zone (depicted by the purple lines) and were this to be a relatively average year, the voyage back up to good old Base Camp 1377 looked to be very viable. 'Course, still 'tis, given all the pricing support shown in the above chart though the Nov'14 - Jan'14 stretch. And unless the stock market is now rising because it stealthily already sees QE-IV a-comin', its extreme over-valuation at some point shall cause the S&P to crack, its negative correlation to Gold in turn shifting the yellow metal up into high gear. But as it now stands, the S&P continues to get the bids whilst Gold remains on the skids. Here month-over-month are the percentage tracks of Gold vs. the S&P, including (at the request of a highly-valued reader), Newmont Mining (NYSE:NEM)'s bucking Gold's most recent struggles, the arguably "mother of all miners" indeed year-to-date being +35%, (the bulk of which came during January):
Still, one cannot underestimate the uplifting equities effect of another QE. Remember that hot ABBA hit from 1979 entitled 'Gimme, Gimme, Gimme'.
This FinMedia piece from the past week puts "Gimmie QE" in perfect perspective: "German investor confidence rose to the highest level in a year in February, buoyed by the imminent arrival of fresh central-bank stimulus", (i.e. "We don't need no stinkin' earnings").
And again, what of the EuroZone's ongoing cohesion given the state of its PIIGS? Yes, Greece as noted has been given four months to sort out its bailout woes, but were it to fail so do, German finance minister Wolfgang "The Sly Guy" Schäuble says that, alas, Hellas shan't receive further funding. That in turn ought make it the first of the heavily-indebted PIIGS dominoes to fall, albeit Greece is quite small: its GDP at $242B is comparable to Apple's total assets of $231B, (and given a market capitalization currently of $754B, perhaps Tim Cook could simply arrange to buy Greece and thereby establish it as their Eastern Hemisphere node of operations ... just a thought). The balance of the PIIGS brethren are ostensibly doing a bit better, but at the end of the day, debt begets debt (just look at our side of the pond), debt begets debasement, debasement depletes wealth, and aren't you lucky you've held onto your Gold (!)
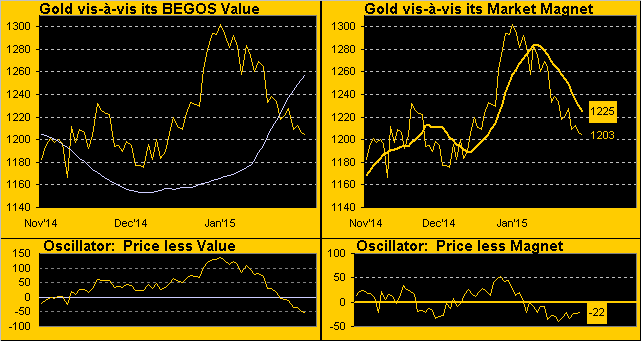
Most recently Gold has swung from being technically overbought to now having become technically oversold, at least by these like three-month measures in the next two-panel graphic. On the left is our classic measure of Gold vis-à-vis its smooth pearly value line borne of price movement relative to same in the primary BEGOS Markets (Bond / Euro/ Gold/ Oil/ S&P). Beneath the chart in the oscillator (price less value), the current level of -50 points is typically as low as Gold reaches below value, barring strong selling which we're simply not seeing this time 'round. On the right is our measure of Gold vis-à-vis its Market Magnet, which is the 10-day contract volume-weighted price average (1225); clearly by its oscillator (price less Magnet), price cannot stray too far from its magnet (hence the name), such that the current -22 level suggests some snap-back upward is in order:
Now to this next two-panel portrayal. This time on the left we've the last three months of Gold's daily bars along with the "Baby Blues" that record 21-day linear regression trend consistency, the blue dots essentially reaching as low as they can go; further price deterioration would find them from this point crawling across the floor; but given the more volatile swinging in price these days, again a move back northward would seem more likely. Then on the right we've Gold's 10-day Market Profile, (the data from which is used to construct the Market Magnet that we just viewed); the labeled apices are those prices seeing the heaviest contract volume and thus represent trading support and resistance levels. Gold twice tested 1197 this past week (on Wednesday and Friday), scampering back above 1200 on both occasions. Indeed, Gold has not settled but one day in the 1100s so far this year, that being on its first trading day (02 January); similarly, it has settled but one day in the 1300s (22 January):
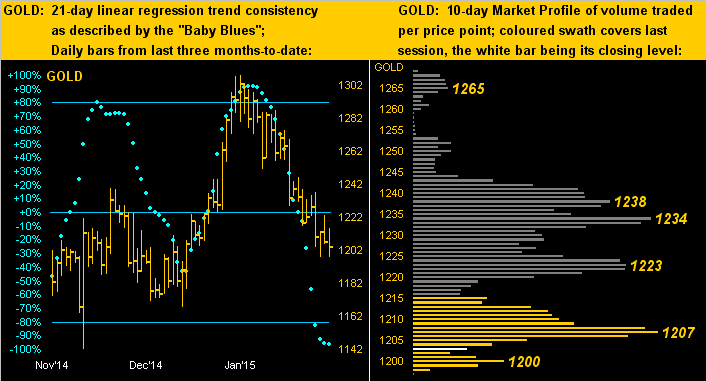
Given there not having been strong volume conviction in Gold's pulling back during these last several weeks, 'tis time for the tide to flow, rather than ebb, toward regaining some upside ground. In fact for those of you scoring at home, Gold's "expected weekly trading range" is currently 46 points; thus were the enusing week's low to hold right here around 1200, we may find the high in turn to come in right around the base of the 1240-1280 resistance zone. Which leads us to the first of these three quick hits as we call it week:
1) Incoming Econ Data: next week brings up a substantive "back-loaded" stint of it including our second look at Q4 GDP: estimates have it closer to being just 2% versus the initial 2.6% reading issued back on 30 January, which in turn was basically half of the 5.0% final reporting for Q3. Thus we are potentially about to see a swing in a single quarter's growth from 5% down to 2%: that's a 60% growth reduction!
2) Rolls-Royce (with Gold?): this iconic division of Bayerische Motoren Werke has announced 'twill launch its first Sports Utility Vehicle. Really? No doubt here in the "1% Land" of San Francisco, we'll see them further cluttering up our streets and blocking our driving visibility in adding to the already daunting population we have here of UAVs ("Urban Assault Vehicles"). One wonders how much inlaid Gold there'll be in the coachwork, for 'tis a Rolls, non? Might it even compete with the Hummer in length, such that when double-parked unattended, 'twill block not just two but three parking spaces in front of Peet's Coffee? That'll be 50% more horn blowing!
3) The Website and Silver: Finally, for all of you ardent website followers out there, we've added a fifth technical study to the Market Rhythms page: Parabolics! Yes, that same study which is an integral part of The Gold Update's weekly bars is now rigorously tested daily across all eight of the BEGOS Market components and their assigned time frames toward sussing out the best of the bunch. As an example at this writing, on the Market Rhythms list you'll presently see Silver's parabolic study on the 8-hr. time frame to be quite consistent in getting it right. "Hi-Ho Sister Silver!"
See you next week at month's end. In the meantime, keep a civil eye on both the Baro and the sky...